

Download Volume II Accomplisments (28 Mb pdf). - IRIS
Download Volume II Accomplisments (28 Mb pdf). - IRIS
Download Volume II Accomplisments (28 Mb pdf). - IRIS

You also want an ePaper? Increase the reach of your titles
YUMPU automatically turns print PDFs into web optimized ePapers that Google loves.
Mozambique Earthquake Sequence of 2006: High-Angle Normal<br />
Faulting in Southern Africa<br />
Z Yang (Univ. of Colorado, Boulder), W.-P. Chen (Univ. of Illinois, Urbana)<br />
We report source mechanisms for the six largest shocks of the Mozambique earthquake sequence of 22 February 2006. The<br />
main shock of this sequence is one of the largest (Mw ~ 7.0) to occur in Africa over the past 100 years and its P waveforms alone<br />
are sufficient to show that north‐south trending normal faulting near the surface continues to depths of more than 15 km along<br />
an exceptionally steep dip of 76° ± 4°. This new result shows that globally seismogenic normal faulting spans a wide range of<br />
dips, from about 30° to 75°. S waveforms, when combined with a minor component of left‐lateral slip observed in the field, indicate<br />
the rake to be between −80° and −89° which, in turn, places a new constraint on relative plate motions: Complications from<br />
a nonspecific Rovuma microplate notwithstanding, our results favor the Euler pole between the Somalia and Nubia plates to lie<br />
southward of the epicenters.<br />
Acknowledgements: We thank E. Calais, C. Collettini, C. Hartnady, R. Sibson, S. Stein, and Y. D. Zheng, for helpful discussions. In particular,<br />
S. Marshak suggested antithetic faulting in a listric master system. The data management centers of <strong>IRIS</strong> and GEOSCOPE kindly provided<br />
seismograms to us, and D. Doser, C.J. Ebinger, and B.W. Stump made careful reviews of the manuscript. This work is supported by<br />
the U.S. National Science Foundation grant EAR9909362 (Project Hi-CLIMB: An Integrated Study of the Himalayan-Tibetan Continental<br />
Lithosphere during Mountain Building, contribution I06). Any opinions, findings, and conclusions or recommendations expressed in this<br />
material are those of the authors and do not necessarily reflect those of the NSF.<br />
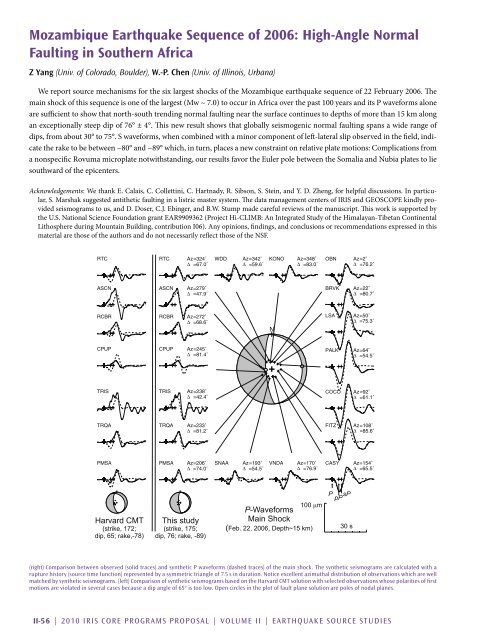
(right) Comparison between observed (solid traces) and synthetic P waveforms (dashed traces) of the main shock. The synthetic seismograms are calculated with a<br />
rupture history (source time function) represented by a symmetric triangle of 7.5 s in duration. Notice excellent azimuthal distribution of observations which are well<br />
matched by synthetic seismograms. (left) Comparison of synthetic seismograms based on the Harvard CMT solution with selected observations whose polarities of first<br />
motions are violated in several cases because a dip angle of 65° is too low. Open circles in the plot of fault plane solution are poles of nodal planes.<br />
<strong>II</strong>-56 | 2010 <strong>IRIS</strong> Core Programs Proposal | <strong>Volume</strong> <strong>II</strong> | Earthquake Source Studies


