

Download Volume II Accomplisments (28 Mb pdf). - IRIS
Download Volume II Accomplisments (28 Mb pdf). - IRIS
Download Volume II Accomplisments (28 Mb pdf). - IRIS

You also want an ePaper? Increase the reach of your titles
YUMPU automatically turns print PDFs into web optimized ePapers that Google loves.
Characterizing the Calico Fault Damage Zone Using Seismic and<br />
Geodetic Data<br />
Elizabeth S. Cochran (University of California, Riverside), Yong-Gang Li (University of Southern California), Peter M.<br />
Shearer (Scripps Institution of Oceanography), Sylvain Barbot (Scripps Institution of Oceanography), Yuri Fialko<br />
(Scripps Institution of Oceanography), John E. Vidale (University of Washington)<br />
During earthquakes slip is often localized on preexisting faults, but it is not well understood how the structure of crustal faults<br />
may contribute to slip localization and energetics. Growing evidence suggests that the crust along active faults suffers anomalous<br />
strain and damage during large quakes. Seismic and geodetic data from the Calico fault in the eastern California shear zone<br />
reveal a wide zone of reduced seismic velocities and effective elastic moduli. Using seismic travel times, trapped waves, and<br />
interferometric Synthetic Aperture Radar observations, we document seismic velocities reduced by 40 - 50% and shear moduli<br />
reduced by 65% compared to wallrock in a 1.5-km-wide zone along the Calico fault [Cochran et al., 2009]. Observed velocity<br />
reductions likely represent the cumulative mechanical damage from past earthquake ruptures. No large earthquake has broken<br />
the Calico fault in historic time, implying that fault damage persists for hundreds or perhaps thousands of years. These findings<br />
indicate that faults can affect rock properties at substantial distances from primary fault slip surfaces, and throughout much of<br />
the seismogenic zone, a result with implications for the portion of energy expended during rupture to drive cracking and yielding<br />
of rock and development of fault systems.<br />
References<br />
Cochran, E.S., Li, Y.-G., Shearer, P.M., Barbot, S., Fialko, Y., and Vidale, J.E., Seismic and Geodetic Evidence for Extensive, Long-Lived, Fault<br />
Damage Zones, Geology, 37(4), 315-318, 2009.<br />
Acknowledgements: This research was supported by NSF (EAR-0439947) and SCEC (contribution number 1185).<br />
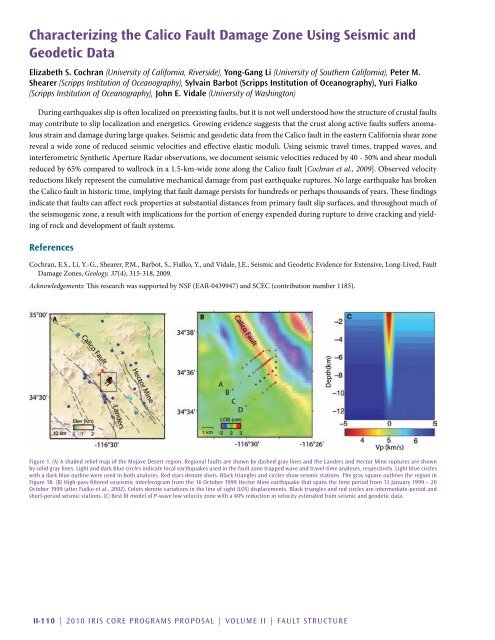
Figure 1. (A) A shaded relief map of the Mojave Desert region. Regional faults are shown by dashed gray lines and the Landers and Hector Mine ruptures are shown<br />
by solid gray lines. Light and dark blue circles indicate local earthquakes used in the fault zone trapped wave and travel-time analyses, respectively. Light blue circles<br />
with a dark blue outline were used in both analyses. Red stars denote shots. Black triangles and circles show seismic stations. The gray square outlines the region in<br />
Figure 1B. (B) High-pass-filtered coseismic interferogram from the 16 October 1999 Hector Mine earthquake that spans the time period from 13 January 1999 – 20<br />
October 1999 (after Fialko et al., 2002). Colors denote variations in the line of sight (LOS) displacements. Black triangles and red circles are intermediate-period and<br />
short-period seismic stations. (C) Best fit model of P-wave low velocity zone with a 40% reduction in velocity estimated from seismic and geodetic data.<br />
<strong>II</strong>-110 | 2010 <strong>IRIS</strong> Core Programs Proposal | <strong>Volume</strong> <strong>II</strong> | Fault Structure


