

Download Volume II Accomplisments (28 Mb pdf). - IRIS
Download Volume II Accomplisments (28 Mb pdf). - IRIS
Download Volume II Accomplisments (28 Mb pdf). - IRIS

Create successful ePaper yourself
Turn your PDF publications into a flip-book with our unique Google optimized e-Paper software.
An Earthquake-Like Magnitude-Frequency Distribution of Tectonic<br />
Tremor in Northern Cascadia<br />
Kenneth Creager (University of Washington), Aaron Wech (University of Washington), Heidi Houston (University of<br />
Washington), John Vidale (University of Washington)<br />
Major episodic tremor and slip (ETS) events with Mw 6.4 to 6.7 repeat every 15 ± 2 months within the Cascadia subduction<br />
zone under the Olympic Peninsula. Although these major ETS events are observed to release strain, smaller “tremor swarms”<br />
without detectable geodetic deformation are more frequent. We employ a Waveform Envelope Cross-Correlation and Clustering<br />
(WECC) [Wech and Creager, 2008] algorithm to search every 50%-overlapping 5-minute window for tremor. The resulting<br />
20,000 tremor epicenters from 2006 through 2009 in northern Washington naturally cluster in space and time into the 91 tremor<br />
swarms analyzed here. We find that 88 inter-ETS tremor swarms account for 45% of the total duration of tremor detection during<br />
the last three ETS cycles. Considering duration as proportional to moment release, the swarms follow a standard Gutenberg-<br />
Richter frequency-magnitude relation, with the major ETS events lying on the trend defined by inter-ETS swarms. This relationship<br />
implies that 1) inter-ETS swarms are fundamentally similar to the major events, just smaller and more frequent; and 2)<br />
despite fundamental differences in moment-duration scaling, the tremor magnitude-frequency distribution has the same power<br />
law trend of normal earthquakes with a b-value of 1.<br />
References<br />
Aguiar, A. C., et al. (2009), Moment release rate of Cascadia tremor constrained by GPS, J. Geophys. Res., 114, 1-11.<br />
Wech, A. G., and K. C. Creager (2008), Automated detection and location of Cascadia tremor, Geophys. Res. Lett., 35, 1-5.<br />
Acknowledgements: This study was supported by the National Science Foundation/EarthScope (EAR-0545441) and the USGS (08HQGR0034,<br />
G09AP00024, G10AP00033). Primary data were supplied by PNSN, EarthScope, PBO and PGC seismometers.<br />
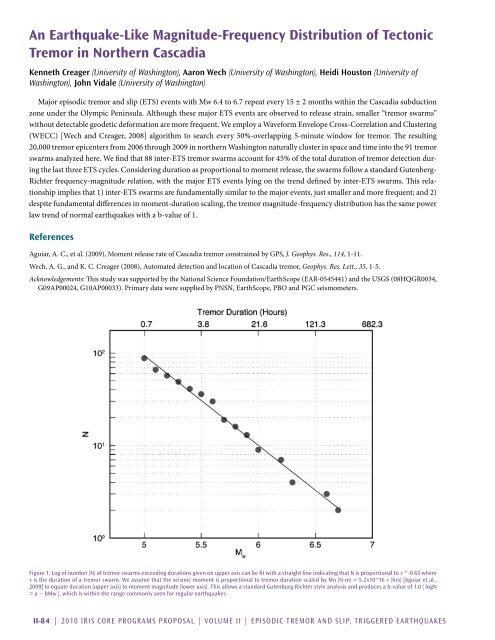
Figure 1. Log of number (N) of tremor swarms exceeding durations given on upper axis can be fit with a straight line indicating that N is proportional to τ ^-0.65 where<br />
τ is the duration of a tremor swarm. We assume that the seismic moment is proportional to tremor duration scaled by Mo (N-m) = 5.2x10^16 τ (hrs) [Aguiar et al.,<br />
2009] to equate duration (upper axis) to moment magnitude (lower axis). This allows a standard Gutenburg-Richter style analysis and produces a b-value of 1.0 ( logN<br />
= a − bMw ), which is within the range commonly seen for regular earthquakes.<br />
<strong>II</strong>-84 | 2010 <strong>IRIS</strong> Core Programs Proposal | <strong>Volume</strong> <strong>II</strong> | Episodic Tremor and Slip, Triggered Earthquakes


