

Download Volume II Accomplisments (28 Mb pdf). - IRIS
Download Volume II Accomplisments (28 Mb pdf). - IRIS
Download Volume II Accomplisments (28 Mb pdf). - IRIS

Create successful ePaper yourself
Turn your PDF publications into a flip-book with our unique Google optimized e-Paper software.
High-Resolution Locations of Triggered Earthquakes and<br />
Tomographic Imaging of Kilauea Volcano's South Flank<br />
E. M. Syracuse (University of Wisconsin-Madison), C. H. Thurber (University of Wisconsin-Madison), C. J. Wolfe<br />
(University of Hawaii at Manoa), P. G. Okubo (Hawaii Volcano Observatory), J. H. Foster (University of Hawaii at<br />
Manoa), B. A. Brooks (University of Hawaii at Manoa)<br />
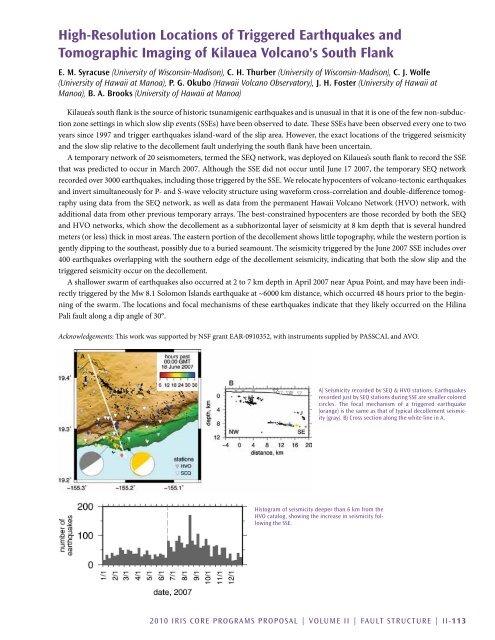
Kilauea’s south flank is the source of historic tsunamigenic earthquakes and is unusual in that it is one of the few non-subduction<br />
zone settings in which slow slip events (SSEs) have been observed to date. These SSEs have been observed every one to two<br />
years since 1997 and trigger earthquakes island-ward of the slip area. However, the exact locations of the triggered seismicity<br />
and the slow slip relative to the decollement fault underlying the south flank have been uncertain.<br />
A temporary network of 20 seismometers, termed the SEQ network, was deployed on Kilauea’s south flank to record the SSE<br />
that was predicted to occur in March 2007. Although the SSE did not occur until June 17 2007, the temporary SEQ network<br />
recorded over 3000 earthquakes, including those triggered by the SSE. We relocate hypocenters of volcano-tectonic earthquakes<br />
and invert simultaneously for P- and S-wave velocity structure using waveform cross-correlation and double-difference tomography<br />
using data from the SEQ network, as well as data from the permanent Hawaii Volcano Network (HVO) network, with<br />
additional data from other previous temporary arrays. The best-constrained hypocenters are those recorded by both the SEQ<br />
and HVO networks, which show the decollement as a subhorizontal layer of seismicity at 8 km depth that is several hundred<br />
meters (or less) thick in most areas. The eastern portion of the decollement shows little topography, while the western portion is<br />
gently dipping to the southeast, possibly due to a buried seamount. The seismicity triggered by the June 2007 SSE includes over<br />
400 earthquakes overlapping with the southern edge of the decollement seismicity, indicating that both the slow slip and the<br />
triggered seismicity occur on the decollement.<br />
A shallower swarm of earthquakes also occurred at 2 to 7 km depth in April 2007 near Apua Point, and may have been indirectly<br />
triggered by the Mw 8.1 Solomon Islands earthquake at ~6000 km distance, which occurred 48 hours prior to the beginning<br />
of the swarm. The locations and focal mechanisms of these earthquakes indicate that they likely occurred on the Hilina<br />
Pali fault along a dip angle of 30°.<br />
Acknowledgements: This work was supported by NSF grant EAR-0910352, with instruments supplied by PASSCAL and AVO.<br />
A) Seismicity recorded by SEQ & HVO stations. Earthquakes<br />
recorded just by SEQ stations during SSE are smaller colored<br />
circles. The focal mechanism of a triggered earthquake<br />
(orange) is the same as that of typical decollement seismicity<br />
(gray). B) Cross section along the white line in A.<br />
Histogram of seismicity deeper than 6 km from the<br />
HVO catalog, showing the increase in seismicity following<br />
the SSE.<br />
2010 <strong>IRIS</strong> Core Programs Proposal | <strong>Volume</strong> <strong>II</strong> | Fault Structure | <strong>II</strong>-113


