

Download Volume II Accomplisments (28 Mb pdf). - IRIS
Download Volume II Accomplisments (28 Mb pdf). - IRIS
Download Volume II Accomplisments (28 Mb pdf). - IRIS

Create successful ePaper yourself
Turn your PDF publications into a flip-book with our unique Google optimized e-Paper software.
Community-Outreach Efforts in Data Collection and Analysis for<br />
the 2008 Mogul Earthquake Sequence<br />
Annie Kell-Hills (University of Nevada, Reno), Mahesh S. Dhar (University of Nevada, Reno), Mayo Thompson (University<br />
of Nevada, Reno), John N. Louie (University of Nevada, Reno), Kenneth D. Smith (University of Nevada, Reno)<br />
Beginning Feburary <strong>28</strong>, 2008 the residents of west Reno and Sparks, Nevada experienced continuous earthquakes ranging<br />
in magnitude from M1.0 to M5.0, centered in the west Reno neighborhoods of Mogul and Somersett. The occurrence of these<br />
earthquakes within residential areas stimulated the attention of the public and the media, providing an opportunity for the<br />
Nevada Seismological Laboratory (NSL) to involve the public in earthquake research. The NSL invited the public to host singlechannel<br />
USArray Flexible Array RefTek RT-125A (Texan) recorders in their homes during May and June of 2008. Reno and<br />
Sparks residents volunteered to attend training sessions on installing and hosting recorders at their residences, filling the many<br />
gaps in NSL’s permanent and RAMP station arrays. The use of instruments from the <strong>IRIS</strong> PASSCAL center allowed us to accommodate<br />
the unprecedented volume of public interest in local aftershock response. During the deployments, the 90 instruments<br />
covered a dense area of the Reno area with 106 different deployed locations (see figure). Evaluation of recorded seismograms<br />
for a M3.1 event display atypical responses for areas of bedrock and basin fill, in that bedrock seismograms in the north of Reno<br />
displayed higher than expected amplitudes and long durations, and that some regions of basin fill showed lower than expected<br />
amplitudes. Comparing these seismograms allows us to better interpret basin depths and bedrock locations for the Reno basin,<br />
and allows us to develop better models for local earthquake hazards. Analyses of the recorded data include time delay calculations<br />
and straight-ray tomography. A back-projection of pick delays indicates positive delays in the volcanic hills north of Reno,<br />
atypical of bedrock settings. Curve fitting on a time-distance plot for the M3.1 event estimated a hypocentral depth greater than<br />
the depth derived from NSL’s permanent stations, motivating a study relocating the event depths. Data were then used to relocate<br />
the 97 recorded events by integrating event arrival times recorded with the PASSCAL instruments with the NSL network<br />
database for the permanent, strong-motion, and RAMP stations. Results from simple hypoinverse runs show that the dense station<br />
dataset drastically improves event locations, providing a better understanding of this swarm under urbanized Reno.<br />
Acknowledgements: Research partially supported by the U.S. Geological Survey (USGS), Department of the Interior, under USGS award number<br />
08HQGR0046. The views and conclusions contained in this document are those of the authors and should not be interpreted as necessarily<br />
representing the official policies, either expressed or implied, of the U.S. Government. Instruments used in the field program were<br />
provided by the PASSCAL facility of the Incorporated Research Institutions for Seismology (<strong>IRIS</strong>) through the PASSCAL Instrument<br />
Center at New Mexico Tech. Data collected during this experiment are available through the <strong>IRIS</strong> Data Management Center. The facilities<br />
of the <strong>IRIS</strong> Consortium are supported by the National Science Foundation under Cooperative Agreement EAR-0552316 and by the<br />
Department of Energy National Nuclear Security Administration.<br />
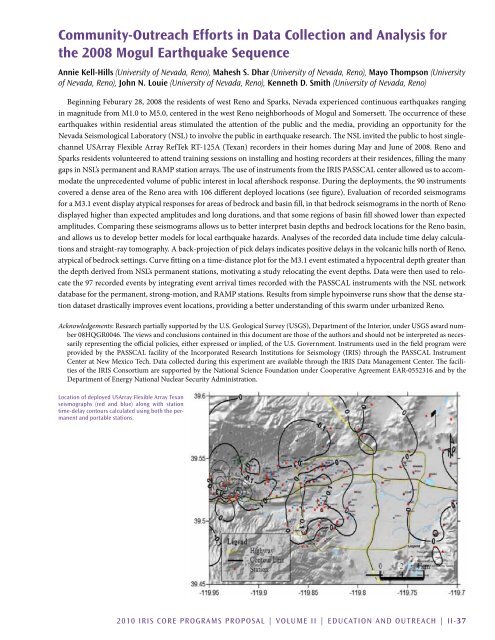
Location of deployed USArray Flexible Array Texan<br />
seismographs (red and blue) along with station<br />
time-delay contours calculated using both the permanent<br />
and portable stations.<br />
2010 <strong>IRIS</strong> Core Programs Proposal | <strong>Volume</strong> <strong>II</strong> | education and outreach | <strong>II</strong>-37


