

Download Volume II Accomplisments (28 Mb pdf). - IRIS
Download Volume II Accomplisments (28 Mb pdf). - IRIS
Download Volume II Accomplisments (28 Mb pdf). - IRIS

You also want an ePaper? Increase the reach of your titles
YUMPU automatically turns print PDFs into web optimized ePapers that Google loves.
Geophysical Detection of Relict Metasomatism from an Archean<br />
(~3.5 Ga) Subduction Zone<br />
Chin-Wu Chen (Carnegie Institution of Washington), Stephane Rondenay (Massachusetts Institute of Technology), Rob.<br />
Evans (Woods Hole Oceanographic Institution), David Snyder (Geological Survey of Canada)<br />
The origin of Archean cratonic lithosphere is the subject of much debate. Geological and geochemical data are consistent<br />
with a plate tectonic origin involving assembly of predominantly oceanic terranes and micro continents into large stable cratons.<br />
Deep probing geophysical surveys of Archean cratons provide a means of understanding the processes responsible for the formation<br />
of these earliest continents, although the signals are complex and present-day cratons are only the surviving remnants<br />
of once larger entities. Here we present a unique geophysical view of structure within the Archean Slave craton, in northwestern<br />
Canada, that shows clear evidence for subduction processes frozen into Archean lithosphere. New seismic imaging results from<br />
the central Slave are synthesized with a coincident magnetotelluric model, and interpreted using petrological and geochemical<br />
constraints from mantle xenoliths. We find the most striking correlation between seismic and electrical structures ever observed<br />
in a continental setting in the form of a coincident seismic discontinuity and electrical conductor at ~100 km depth. The magnitude<br />
of both anomalies, in conjunction with the occurrence of phlogopite rich xenoliths originating at the same depth, point<br />
to a metasomatic origin. We believe that fluids were released from a subducting slab and altered the mantle directly below the<br />
base of a pre-cratonic lithosphere. Our model suggests that cratons are formed by subduction underplating and accretion of preexisting<br />
fragments, and that these processes were active as early as 3.5 billion years ago.<br />
References<br />
Chen, C.-W., S. Rondenay, R. L. Evans, and D. B. Snyder, Geophysical detection of relict metasomatism from an Archean (~3.5 Ga) subduction<br />
zone, Science, 326, 1089-1091, 2009.<br />
Jones, A.G., P. Lezaeta, I.J. Ferguson, A.D. Chave, R. L. Evans, X. Garcia and J. Spratt, The electrical structure of the Slave craton. Lithos, 71,<br />
505-527, 2003.<br />
Acknowledgements: This work is funded by the POLARIS consortium and NSF grant EAR-0409509 (S. R.).<br />
- 115<br />
- 110<br />
- 105<br />
A<br />
0<br />
50<br />
M<br />
B<br />
68<br />
68<br />
Depth (km)<br />
100<br />
150<br />
R1<br />
62<br />
64<br />
66<br />
- 115<br />
B’<br />
B<br />
Seismic discontinuity<br />
Electrical conductive<br />
anomaly<br />
Outline of the harzburgitic layer<br />
(from mantle xenoliths)<br />
Outline of the harzburgitic layer<br />
(from garnet xenocrysts)<br />
A’<br />
A<br />
- 110<br />
km<br />
0 50 100<br />
POLARIS station<br />
MIT station<br />
A-A’: Seismic profile<br />
B-B’: Electrical profile<br />
66<br />
64<br />
- 105<br />
62<br />
180<br />
120 140 160 180 200 220 240<br />
Horizontal distance (km)<br />
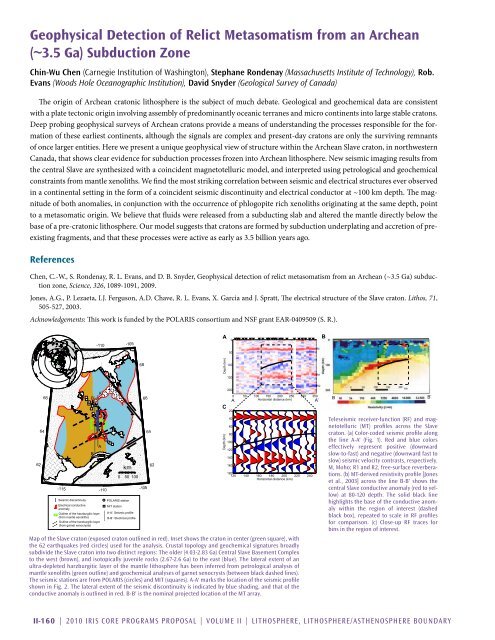
Map of the Slave craton (exposed craton outlined in red). Inset shows the craton in center (green square), with<br />
the 62 earthquakes (red circles) used for the analysis. Crustal topology and geochemical signatures broadly<br />
subdivide the Slave craton into two distinct regions: The older (4.03-2.83 Ga) Central Slave Basement Complex<br />
to the west (brown), and isotopically juvenile rocks (2.67-2.6 Ga) to the east (blue). The lateral extent of an<br />
ultra-depleted harzburgitic layer of the mantle lithosphere has been inferred from petrological analysis of<br />
mantle xenoliths (green outline) and geochemical analyses of garnet xenocrysts (between black dashed lines).<br />
The seismic stations are from POLARIS (circles) and MIT (squares). A-A' marks the location of the seismic profile<br />
shown in Fig. 2. The lateral extent of the seismic discontinuity is indicated by blue shading, and that of the<br />
conductive anomaly is outlined in red. B-B' is the nominal projected location of the MT array.<br />
C<br />
Depth (km)<br />
200<br />
20<br />
40<br />
60<br />
80<br />
100<br />
120<br />
140<br />
160<br />
0 50 100 150 200 250 300 350<br />
A Horizontal distance (km)<br />
A’<br />
R2<br />
B B’<br />
Teleseismic receiver-function (RF) and magnetotelluric<br />
(MT) profiles across the Slave<br />
craton. (a) Color-coded seismic profile along<br />
the line A-A' (Fig. 1). Red and blue colors<br />
effectively represent positive (downward<br />
slow-to-fast) and negative (downward fast to<br />
slow) seismic velocity contrasts, respectively.<br />
M, Moho; R1 and R2, free-surface reverberations.<br />
(b) MT-derived resistivity profile [Jones<br />
et al., 2003] across the line B-B' shows the<br />
central Slave conductive anomaly (red to yellow)<br />
at 80-120 depth. The solid black line<br />
highlights the base of the conductive anomaly<br />
within the region of interest (dashed<br />
black box), repeated to scale in RF profiles<br />
for comparison. (c) Close-up RF traces for<br />
bins in the region of interest.<br />
<strong>II</strong>-160 | 2010 <strong>IRIS</strong> Core Programs Proposal | <strong>Volume</strong> <strong>II</strong> | Lithosphere, Lithosphere/Asthenosphere Boundary


