

Download Volume II Accomplisments (28 Mb pdf). - IRIS
Download Volume II Accomplisments (28 Mb pdf). - IRIS
Download Volume II Accomplisments (28 Mb pdf). - IRIS

You also want an ePaper? Increase the reach of your titles
YUMPU automatically turns print PDFs into web optimized ePapers that Google loves.
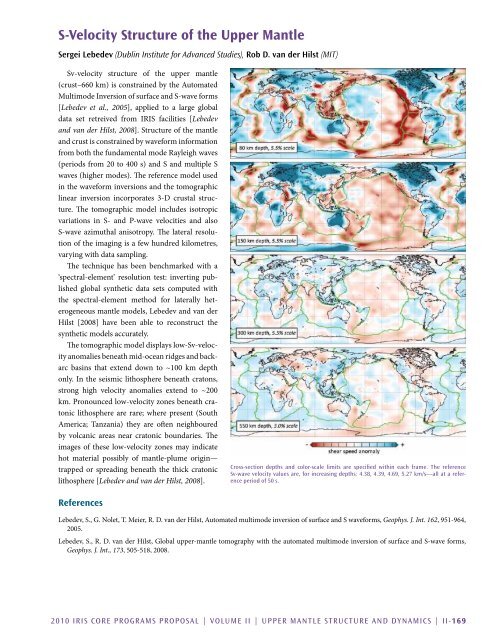
S-Velocity Structure of the Upper Mantle<br />
Sergei Lebedev (Dublin Institute for Advanced Studies), Rob D. van der Hilst (MIT)<br />
Sv-velocity structure of the upper mantle<br />
(crust–660 km) is constrained by the Automated<br />
Multimode Inversion of surface and S-wave forms<br />
[Lebedev et al., 2005], applied to a large global<br />
data set retreived from <strong>IRIS</strong> facilities [Lebedev<br />
and van der Hilst, 2008]. Structure of the mantle<br />
and crust is constrained by waveform information<br />
from both the fundamental mode Rayleigh waves<br />
(periods from 20 to 400 s) and S and multiple S<br />
waves (higher modes). The reference model used<br />
in the waveform inversions and the tomographic<br />
linear inversion incorporates 3-D crustal structure.<br />
The tomographic model includes isotropic<br />
variations in S- and P-wave velocities and also<br />
S-wave azimuthal anisotropy. The lateral resolution<br />
of the imaging is a few hundred kilometres,<br />
varying with data sampling.<br />
The technique has been benchmarked with a<br />
‘spectral-element’ resolution test: inverting published<br />
global synthetic data sets computed with<br />
the spectral-element method for laterally heterogeneous<br />
mantle models, Lebedev and van der<br />
Hilst [2008] have been able to reconstruct the<br />
synthetic models accurately.<br />
The tomographic model displays low-Sv-velocity<br />
anomalies beneath mid-ocean ridges and backarc<br />
basins that extend down to ~100 km depth<br />
only. In the seismic lithosphere beneath cratons,<br />
strong high velocity anomalies extend to ~200<br />
km. Pronounced low-velocity zones beneath cratonic<br />
lithosphere are rare; where present (South<br />
America; Tanzania) they are often neighboured<br />
by volcanic areas near cratonic boundaries. The<br />
images of these low-velocity zones may indicate<br />
hot material possibly of mantle-plume origin—<br />
trapped or spreading beneath the thick cratonic<br />
lithosphere [Lebedev and van der Hilst, 2008].<br />
Cross-section depths and color-scale limits are specified within each frame. The reference<br />
Sv-wave velocity values are, for increasing depths: 4.38, 4.39, 4.69, 5.27 km/s—all at a reference<br />
period of 50 s.<br />
References<br />
Lebedev, S., G. Nolet, T. Meier, R. D. van der Hilst, Automated multimode inversion of surface and S waveforms, Geophys. J. Int. 162, 951-964,<br />
2005.<br />
Lebedev, S., R. D. van der Hilst, Global upper-mantle tomography with the automated multimode inversion of surface and S-wave forms,<br />
Geophys. J. Int., 173, 505-518, 2008.<br />
2010 <strong>IRIS</strong> Core Programs Proposal | <strong>Volume</strong> <strong>II</strong> | Upper Mantle Structure and Dynamics | <strong>II</strong>-169


