

Download Volume II Accomplisments (28 Mb pdf). - IRIS
Download Volume II Accomplisments (28 Mb pdf). - IRIS
Download Volume II Accomplisments (28 Mb pdf). - IRIS

You also want an ePaper? Increase the reach of your titles
YUMPU automatically turns print PDFs into web optimized ePapers that Google loves.
Structure of the California Coast Ranges and San Andreas Fault at<br />
Safod from Seismic Waveform Inversion and Reflection Imaging<br />
Florian Bleibinhaus (Virginia Tech; now at Salzburg Univ.), John A. Hole (Virginia Tech), Trond Ryberg<br />
(GeoForschungsZentrum, Potsdam), Gary S. Fuis (U. S. Geological Survey, Menlo Park)<br />
A seismic reflection and refraction survey across the<br />
San Andreas Fault (SAF) near Parkfield provides a detailed<br />
characterization of crustal structure across the location of<br />
the San Andreas Fault Observatory at Depth (SAFOD).<br />
Steep-dip prestack migration and frequency domain<br />
acoustic waveform tomography were applied to obtain<br />
highly resolved images of the upper 5 km of the crust<br />
for 15 km on either side of the SAF. The resulting velocity<br />
model constrains the top of the Salinian granite with<br />
great detail. Steep-dip reflection seismic images show several<br />
strong-amplitude vertical reflectors in the uppermost<br />
crust near SAFOD that define a 2-km-wide zone comprising<br />
the main SAF and two or more local faults. Another<br />
prominent subvertical reflector at 2–4 km depth 9 km to<br />
the northeast of the SAF marks the boundary between the<br />
Franciscan terrane and the Great Valley Sequence. A deep<br />
seismic section of low resolution shows several reflectors<br />
in the Salinian crust west of the SAF. Two horizontal<br />
reflectors around 10 km depth correlate with strains of<br />
seismicity observed along-strike of the SAF. They represent<br />
midcrustal shear zones partially decoupling the ductile<br />
lower crust from the brittle upper crust. The deepest<br />
reflections from 25 km depth are interpreted as the crustmantle<br />
boundary.<br />
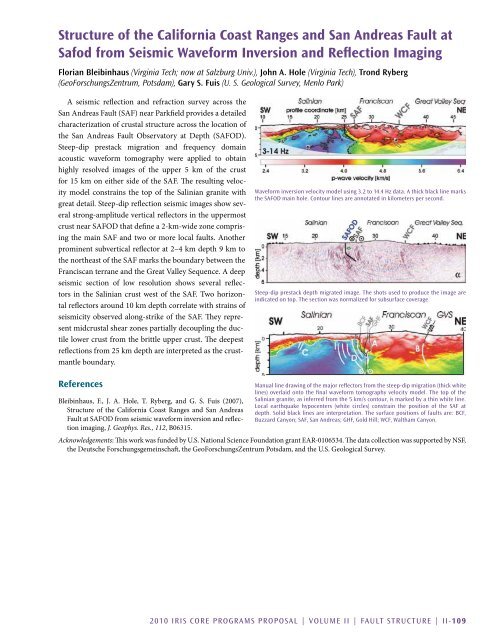
Waveform inversion velocity model using 3.2 to 14.4 Hz data. A thick black line marks<br />
the SAFOD main hole. Contour lines are annotated in kilometers per second.<br />
Steep-dip prestack depth migrated image. The shots used to produce the image are<br />
indicated on top. The section was normalized for subsurface coverage.<br />
References<br />
Bleibinhaus, F., J. A. Hole, T. Ryberg, and G. S. Fuis (2007),<br />
Structure of the California Coast Ranges and San Andreas<br />
Fault at SAFOD from seismic waveform inversion and reflection<br />
imaging, J. Geophys. Res., 112, B06315.<br />
Manual line drawing of the major reflectors from the steep-dip migration (thick white<br />
lines) overlaid onto the final waveform tomography velocity model. The top of the<br />
Salinian granite, as inferred from the 5 km/s contour, is marked by a thin white line.<br />
Local earthquake hypocenters (white circles) constrain the position of the SAF at<br />
depth. Solid black lines are interpretation. The surface positions of faults are: BCF,<br />
Buzzard Canyon; SAF, San Andreas; GHF, Gold Hill; WCF, Waltham Canyon.<br />
Acknowledgements: This work was funded by U.S. National Science Foundation grant EAR-0106534. The data collection was supported by NSF,<br />
the Deutsche Forschungsgemeinschaft, the GeoForschungsZentrum Potsdam, and the U.S. Geological Survey.<br />
2010 <strong>IRIS</strong> Core Programs Proposal | <strong>Volume</strong> <strong>II</strong> | Fault Structure | <strong>II</strong>-109


