

Download Volume II Accomplisments (28 Mb pdf). - IRIS
Download Volume II Accomplisments (28 Mb pdf). - IRIS
Download Volume II Accomplisments (28 Mb pdf). - IRIS

Create successful ePaper yourself
Turn your PDF publications into a flip-book with our unique Google optimized e-Paper software.
410 Discontinuity<br />
Three-Dimensional Geometry of the Juan de Fuca/farallon Slab<br />
Gary Pavlis (Department of Geological Sciences, Indiana University, Bloomington)<br />
New understanding on the three-dimensional geometry of the western US subduction system is emerging by viewing multiple<br />
imaging results in a fully three-dimensional framework. The process is comparable to interpreting 3D seismic reflection data, but<br />
is complicated in USArray by the scale, which makes spherical geometry important. The figure shown is a first attempt at a joint<br />
interpretation of P tomography models by Burdick et al. [2009], Sigloch et al. [2008], and recently produced scattered wave images<br />
of Pavlis [submitted]. The scattered wave images show dipping features above the 410 km discontinuity I have interpreted as defining<br />
a shear zone at the boundary layer between the subducting slab and the overriding North American plate. The model shown<br />
in this figure is a kinematic model showing flow lines and constant time lines based on the current relative motion of the Juan<br />
de Fuca and North American plates. The surface is interpreted from data, but the time lines assume no longitudinal strain in the<br />
descending slab. The visualization shows the predicted edge of the slab window from the San Andreas based on the no longitudinal<br />
strain approximation and using the current trace of the San Andreas as an anchor point. The new scattered wave images and the<br />
reasonable geometry of this slab model provide strong support for the model of the Farallon slab described by Sigloch et al. [2008].<br />
References<br />
Burdick, S., C. Li, V. Martynov, T. Cox, J. Eakins, T. Mulder, L. Astiz, F. L. Vernon, G. L. Pavlis, and R. D. van der Hilst, 2009, Model update<br />
December 2008; upper mantle heterogeneity beneath North America from P-wave travel time tomography with global and USArray transportable<br />
array data, Seismol. Res. Lett., 80(4), 384-392, doi: 10.1785/gssrl.80.4.638.<br />
Pavlis, G. L., submitted, Three-dimensional Wavefield Imaging of Data from the USArray: New Constraints on the Geometry of the Farallon<br />
Slab, Geosphere, in review.<br />
Sigloch, K., N. McQuarrie, and G. Nolet, 2008, Two-stage subduction history under North America inferred from multiple-frequency tomography,<br />
Nature Geosci., 1, 458-462, doi:10.1038/ngeo231.<br />
Acknowledgements: This work was supported by the National Science Foundation under CMG-0327827. It also benefited from advanced computing<br />
resources provided by the National Science Foundations TeraGrid program at Indiana University.<br />
Burdick et al (2009)<br />
P tomography model<br />
Edge of Slab<br />
Window<br />
P to S scattered<br />
Wave Image<br />
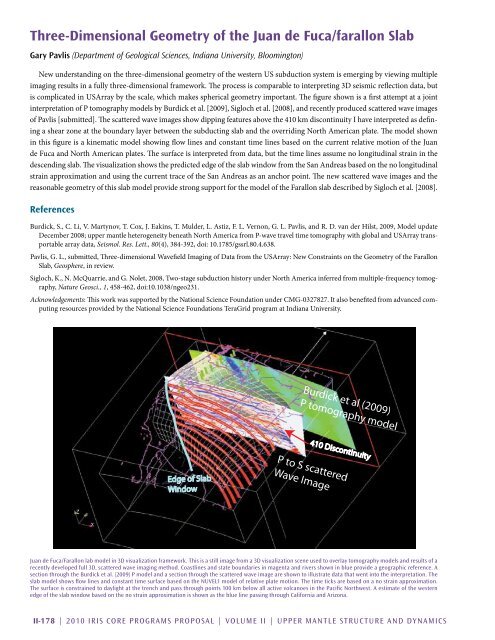
Juan de Fuca/Farallon lab model in 3D visualization framework. This is a still image from a 3D visualization scene used to overlay tomography models and results of a<br />
recently developed full 3D, scattered wave imaging method. Coastlines and state boundaries in magenta and rivers shown in blue provide a geographic reference. A<br />
section through the Burdick et al. (2009) P model and a section through the scattered wave image are shown to illustrate data that went into the interpretation. The<br />
slab model shows flow lines and constant time surface based on the NUVEL1 model of relative plate motion. The time ticks are based on a no strain approximation.<br />
The surface is constrained to daylight at the trench and pass through points 100 km below all active volcanoes in the Pacific Northwest. A estimate of the western<br />
edge of the slab window based on the no strain approximation is shown as the blue line passing through California and Arizona.<br />
<strong>II</strong>-178 | 2010 <strong>IRIS</strong> Core Programs Proposal | <strong>Volume</strong> <strong>II</strong> | Upper Mantle Structure and Dynamics


