

Download Volume II Accomplisments (28 Mb pdf). - IRIS
Download Volume II Accomplisments (28 Mb pdf). - IRIS
Download Volume II Accomplisments (28 Mb pdf). - IRIS

Create successful ePaper yourself
Turn your PDF publications into a flip-book with our unique Google optimized e-Paper software.
Optimized Velocities and Prestack Depth Migration in the Reno-<br />
Area Basin<br />
John N. Louie (University of Nevada, Reno), Satish Pullammanappallil (Optim, Inc.), Annie Kell-Hills (University of<br />
Nevada, Reno)<br />
We collected seismic reflection profiles in the Reno, Nevada area basin in collaboration with the USGS and nees@UTexas<br />
during June 2009. Stratigraphic horizons and vertical offsets associated with faulting appear along a 6.72 km Truckee River<br />
profile while strong, horizontally propagating body waves are seen in shot gathers from the southern 3.84 km Manzanita Lane<br />
profile (fig. 1). Reno-area basin fill overlies Miocene andesitic volcanic rocks and consists of Neogene sedimentary rocks and<br />
Quaternary outwash deposits. Using the seismic shot records, we created optimized velocity models of the Reno basin using<br />
commercial SeisOpt®@2D software. The refracted P-wave arrivals provide inputs for a global velocity model over the length<br />
of the profiles and to a depth proportional to the source offset distances, expected to be 150-200 m. Within this basin most of<br />
the lateral velocity heterogeneity appears within 200 m of the surface. Comparing this velocity model to stacked sections produced<br />
by the USGS added confidence to the interpretations of strong reflection boundaries seen in the seismic sections (fig. 2).<br />
Boundaries in the velocity model coincide with prominent reflection boundaries as well as with known depths of volcanic fill<br />
and other deposits, constraining their depths and velocities. The tomographic velocity sections were then used as input with the<br />
shot records to a Kirchhoff pre-stack depth migration (PSDM) imaging steeply dipping structure and further constraining current<br />
interpretations and fault/basin geometry. The PSDM resolved the cause of the horizontally propagating waves seen along<br />
Manzanita Lane as sidewall reflections from a steeply dipping fault (fig. 3).<br />
Acknowledgements: Research supported by the U.S. Geological Survey (USGS), Department of the Interior, under USGS award numbers<br />
G09AP00051, 08HQGR0015, and 08HQGR0046. The views and conclusions contained in this document are those of the authors and<br />
should not be interpreted as necessarily representing the official policies, either expressed or implied, of the U.S. Government.<br />
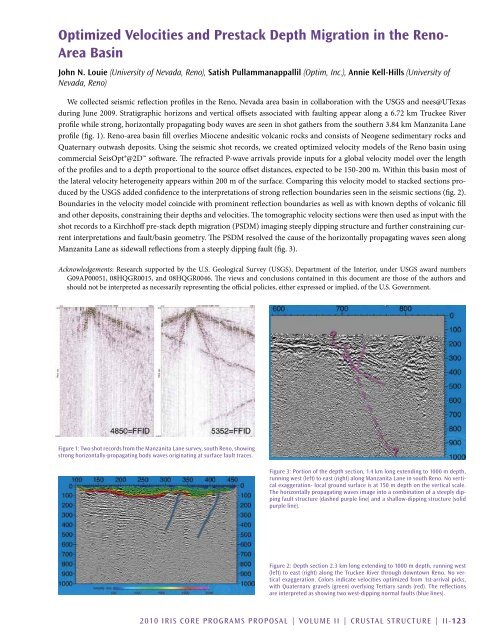
Figure 1: Two shot records from the Manzanita Lane survey, south Reno, showing<br />
strong horizontally-propagating body waves originating at surface fault traces.<br />
Figure 3: Portion of the depth section, 1.4 km long extending to 1000 m depth,<br />
running west (left) to east (right) along Manzanita Lane in south Reno. No vertical<br />
exaggeration- local ground surface is at 150 m depth on the vertical scale.<br />
The horizontally propagating waves image into a combination of a steeply dipping<br />
fault structure (dashed purple line) and a shallow-dipping structure (solid<br />
purple line).<br />
Figure 2: Depth section 2.3 km long extending to 1000 m depth, running west<br />
(left) to east (right) along the Truckee River through downtown Reno. No vertical<br />
exaggeration. Colors indicate velocities optimized from 1st-arrival picks,<br />
with Quaternary gravels (green) overlying Tertiary sands (red). The reflections<br />
are interpreted as showing two west-dipping normal faults (blue lines).<br />
2010 <strong>IRIS</strong> Core Programs Proposal | <strong>Volume</strong> <strong>II</strong> | Crustal Structure | <strong>II</strong>-123


