

Download Volume II Accomplisments (28 Mb pdf). - IRIS
Download Volume II Accomplisments (28 Mb pdf). - IRIS
Download Volume II Accomplisments (28 Mb pdf). - IRIS

Create successful ePaper yourself
Turn your PDF publications into a flip-book with our unique Google optimized e-Paper software.
Tomographic Image of the Crust and Upper Mantle Beneath the<br />
Western Tien Shan from the MANAS Broadband Deployment:<br />
Possible Evidence for Lithospheric Delamination<br />
Steven Roecker (Rensselaer Polytech. Inst.), Li Zhiwei (Rensselaer Polytech. Inst)<br />
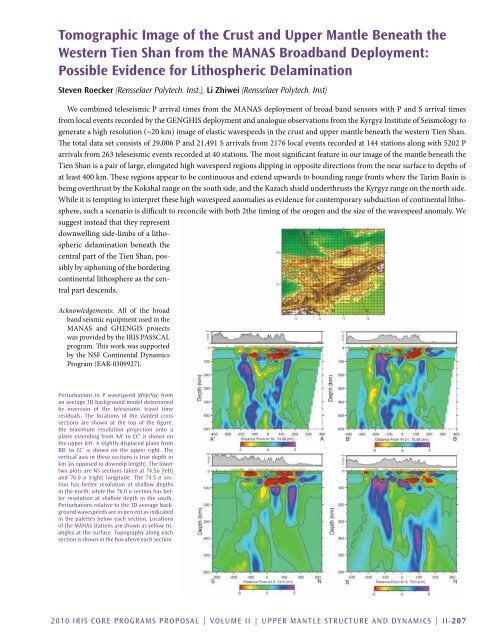
We combined teleseismic P arrival times from the MANAS deployment of broad band sensors with P and S arrival times<br />
from local events recorded by the GENGHIS deployment and analogue observations from the Kyrgyz Institute of Seismology to<br />
generate a high resolution (~20 km) image of elastic wavespeeds in the crust and upper mantle beneath the western Tien Shan.<br />
The total data set consists of 29,006 P and 21,491 S arrivals from 2176 local events recorded at 144 stations along with 5202 P<br />
arrivals from 263 teleseismic events recorded at 40 stations. The most significant feature in our image of the mantle beneath the<br />
Tien Shan is a pair of large, elongated high wavespeed regions dipping in opposite directions from the near surface to depths of<br />
at least 400 km. These regions appear to be continuous and extend upwards to bounding range fronts where the Tarim Basin is<br />
being overthrust by the Kokshal range on the south side, and the Kazach shield underthrusts the Kyrgyz range on the north side.<br />
While it is tempting to interpret these high wavespeed anomalies as evidence for contemporary subduction of continental lithosphere,<br />
such a scenario is difficult to reconcile with both 2the timing of the orogen and the size of the wavespeed anomaly. We<br />
suggest instead that they represent<br />
downwelling side-limbs of a lithospheric<br />
delamination beneath the<br />
central part of the Tien Shan, possibly<br />
by siphoning of the bordering<br />
continental lithosphere as the central<br />
part descends.<br />
Acknowledgements: All of the broad<br />
band seismic equipment used in the<br />
MANAS and GHENGIS projects<br />
was provided by the <strong>IRIS</strong> PASSCAL<br />
program. This work was supported<br />
by the NSF Continental Dynamics<br />
Program (EAR-0309927).<br />
Perturbations to P wavespeed (dVp/Vp) from<br />
an average 1D background model determined<br />
by inversion of the teleseismic travel time<br />
residuals. The locations of the slanted cross<br />
sections are shown at the top of the figure:<br />
the maximum resolution projection onto a<br />
plane extending from AA' to CC’ is shown on<br />
the upper left. A slightly displaced plane from<br />
BB’ to CC’ is shown on the upper right. The<br />
vertical axis in these sections is true depth in<br />
km (as opposed to downdip length). The lower<br />
two plots are NS sections taken at 74.5o (left)<br />
and 76.0 o (right) longitude. The 74.5 o section<br />
has better resolution at shallow depths<br />
in the north, while the 76.0 o section has better<br />
resolution at shallow depth in the south.<br />
Perturbations relative to the 1D average background<br />
wavespeeds are in percent as indicated<br />
in the palettes below each section. Locations<br />
of the MANAS stations are shown as yellow triangles<br />
at the surface. Topography along each<br />
section is shown in the box above each section.<br />
2010 <strong>IRIS</strong> Core Programs Proposal | <strong>Volume</strong> <strong>II</strong> | Upper Mantle Structure and Dynamics | <strong>II</strong>-207


