

Download Volume II Accomplisments (28 Mb pdf). - IRIS
Download Volume II Accomplisments (28 Mb pdf). - IRIS
Download Volume II Accomplisments (28 Mb pdf). - IRIS

Create successful ePaper yourself
Turn your PDF publications into a flip-book with our unique Google optimized e-Paper software.
Seismic Wave Gradiometry Using Multiwavelets: Documented<br />
Surface Wave Reflections<br />
Christian Poppeliers (Augusta State University, Dept. of Chem. and Physics)<br />
In the <strong>IRIS</strong>-produced document “Seismological Grand Challenges in Understanding Earth’s Dynamic Systems”, states several<br />
challenges to the seismological community. The work presented here addresses the second Challenge: ‘How Does the Near<br />
Surface Environment Affect Natural Hazards and Resources’. Specifically, this work makes strides in quantifying highly complex<br />
scattering affects attributed to near-surface geologic conditions using a new seismic processing technique known as seismic wave<br />
gradiometry. The method is based on using displacement gradients as measured by a small scale array to estimate wave velocity,<br />
wave propagation direction, and spatial amplitude changes at all points on the seismogram [e.g. Langston, 2007]. Conventional<br />
seismic array processing is not ideally suited to resolve highly complex wave attributes as the wavelength of the wave is typically<br />
much smaller than the array aperture. Thus, small-scale time-dependant scattering affects may be missed. Conversely, an array<br />
designed as a gradiometer has an aperture of less than 10% of the smallest wavelength of the wavefield being analyzed. Thus a<br />
gradiometer is essentially a “point array”, recording the wavefield within a fraction of a wavelength.<br />
The work presented here shows an example of complex surface wave interactions as recorded at the edge of an artificiallycreated<br />
sedimentary basin [Poppeliers, 2010]. The study site consists of a former open-pit coal mine in which the pit has subsequently<br />
been backfilled with mine tailings [Poppeliers and Pavlis, 2002]. A series of artificial-source explosions provided the<br />
seismic source. Because the wave attributes are highly frequency dependant, we have incorporated multi-wavelets into existing<br />
wave gradiometery methodologies, which allows us to quantify frequency-dependent wave attributes as well as calculate formal<br />
uncertainty estimates; the result is that wave attributes, as well as their confidence intervals, can be estimated as a function of<br />
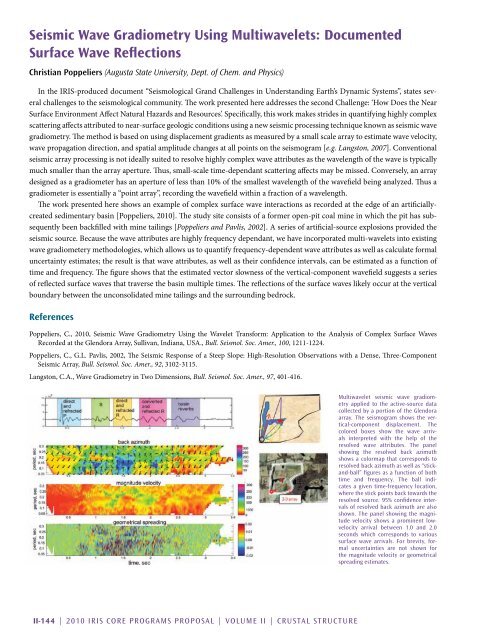
time and frequency. The figure shows that the estimated vector slowness of the vertical-component wavefield suggests a series<br />
of reflected surface waves that traverse the basin multiple times. The reflections of the surface waves likely occur at the vertical<br />
boundary between the unconsolidated mine tailings and the surrounding bedrock.<br />
References<br />
Poppeliers, C., 2010, Seismic Wave Gradiometry Using the Wavelet Transform: Application to the Analysis of Complex Surface Waves<br />
Recorded at the Glendora Array, Sullivan, Indiana, USA., Bull. Seismol. Soc. Amer., 100, 1211-1224.<br />
Poppeliers, C., G.L. Pavlis, 2002, The Seismic Response of a Steep Slope: High-Resolution Observations with a Dense, Three-Component<br />
Seismic Array, Bull. Seismol. Soc. Amer., 92, 3102-3115.<br />
Langston, C.A., Wave Gradiometry in Two Dimensions, Bull. Seismol. Soc. Amer., 97, 401-416.<br />
Multiwavelet seismic wave gradiometry<br />
applied to the active-source data<br />
collected by a portion of the Glendora<br />
array. The seismogram shows the vertical-component<br />
displacement. The<br />
colored boxes show the wave arrivals<br />
interpreted with the help of the<br />
resolved wave attributes. The panel<br />
showing the resolved back azimuth<br />
shows a colormap that corresponds to<br />
resolved back azimuth as well as “stickand-ball”<br />
figures as a function of both<br />
time and frequency. The ball indicates<br />
a given time-frequency location,<br />
where the stick points back towards the<br />
resolved source. 95% confidence intervals<br />
of resolved back azimuth are also<br />
shown. The panel showing the magnitude<br />
velocity shows a prominent lowvelocity<br />
arrival between 1.0 and 2.0<br />
seconds which corresponds to various<br />
surface wave arrivals. For brevity, formal<br />
uncertainties are not shown for<br />
the magnitude velocity or geometrical<br />
spreading estimates.<br />
<strong>II</strong>-144 | 2010 <strong>IRIS</strong> Core Programs Proposal | <strong>Volume</strong> <strong>II</strong> | Crustal Structure


