

Download Volume II Accomplisments (28 Mb pdf). - IRIS
Download Volume II Accomplisments (28 Mb pdf). - IRIS
Download Volume II Accomplisments (28 Mb pdf). - IRIS

Create successful ePaper yourself
Turn your PDF publications into a flip-book with our unique Google optimized e-Paper software.
How are Earth’s Internal Boundaries Affected by Dynamics,<br />
Temperature, and Composition?<br />
Maureen D. Long (Yale University)<br />
The nature of dynamic processes that operate in Earth’s interior - and the thermal and chemical structures that result from<br />
these processes - remain fundamental questions for solid earth geophysics. The tools of observational seismology, facilitated<br />
by the increasing availability of broadband seismic data from around the world, yield the tightest constraints available on deep<br />
Earth structure, and in combination with geodynamical models and mineral physics experiments yield powerful insights into<br />
processes operating in the Earth. Dynamic processes affect the Earth’s internal boundaries, including the asthenospheric upper<br />
boundary layer of the mantle convective system, the seismic discontinuities associated with the mantle transition zone, and the<br />
core-mantle boundary (CMB) region, including both the CMB itself and the D” layer. Understanding the detailed structure in<br />
the vicinity of these internal boundaries can help us to distinguish the (often competing) effects of dynamic processes and variations<br />
in temperature and composition on seismological observations. Key observables include velocity and attenuation structure<br />
(both isotropic and anisotropic) and the location and character of seismic discontinuities. For example, observations of seismic<br />
anisotropy, which is particularly important in the boundary layers of the mantle’s convective system, can yield direct constraints<br />
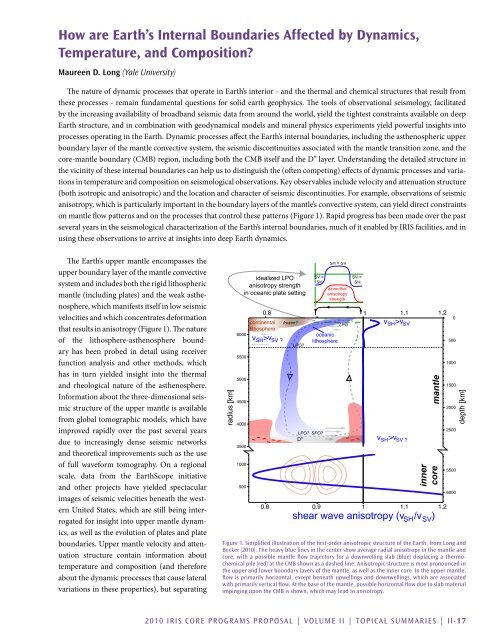
on mantle flow patterns and on the processes that control these patterns (Figure 1). Rapid progress has been made over the past<br />
several years in the seismological characterization of the Earth’s internal boundaries, much of it enabled by <strong>IRIS</strong> facilities, and in<br />
using these observations to arrive at insights into deep Earth dynamics.<br />
The Earth’s upper mantle encompasses the<br />
upper boundary layer of the mantle convective<br />
system and includes both the rigid lithospheric<br />
mantle (including plates) and the weak asthenosphere,<br />
which manifests itself in low seismic<br />
velocities and which concentrates deformation<br />
that results in anisotropy (Figure 1). The nature<br />
of the lithosphere-asthenosphere boundary<br />
has been probed in detail using receiver<br />
function analysis and other methods, which<br />
has in turn yielded insight into the thermal<br />
and rheological nature of the asthenosphere.<br />
Information about the three-dimensional seismic<br />
structure of the upper mantle is available<br />
from global tomographic models, which have<br />
improved rapidly over the past several years<br />
due to increasingly dense seismic networks<br />
and theoretical improvements such as the use<br />
of full waveform tomography. On a regional<br />
scale, data from the EarthScope initiative<br />
and other projects have yielded spectacular<br />
images of seismic velocities beneath the western<br />
United States, which are still being interrogated<br />
for insight into upper mantle dynamics,<br />
as well as the evolution of plates and plate<br />
boundaries. Upper mantle velocity and attenuation<br />
structure contain information about<br />
temperature and composition (and therefore<br />
about the dynamic processes that cause lateral<br />
variations in these properties), but separating<br />
Figure 1. Simplified illustration of the first-order anisotropic structure of the Earth, from Long and<br />
Becker (2010). The heavy blue lines in the center show average radial anisotropy in the mantle and<br />
core, with a possible mantle flow trajectory for a downwelling slab (blue) displacing a thermochemical<br />
pile (red) at the CMB shown as a dashed line. Anisotropic structure is most pronounced in<br />
the upper and lower boundary layers of the mantle, as well as the inner core. In the upper mantle,<br />
flow is primarily horizontal, except beneath upwellings and downwellings, which are associated<br />
with primarily vertical flow. At the base of the mantle, possible horizontal flow due to slab material<br />
impinging upon the CMB is shown, which may lead to anisotropy.<br />
2010 <strong>IRIS</strong> Core Programs Proposal | <strong>Volume</strong> <strong>II</strong> | Topical Summaries | <strong>II</strong>-17


