bold spirit - ArcelorMittal South Africa
bold spirit - ArcelorMittal South Africa
bold spirit - ArcelorMittal South Africa

You also want an ePaper? Increase the reach of your titles
YUMPU automatically turns print PDFs into web optimized ePapers that Google loves.
100<br />
<strong>ArcelorMittal</strong> <strong>South</strong> <strong>Africa</strong><br />
Annual Report 2010<br />
Supplementary information<br />
JSE securities exchange statistics<br />
Exchange statistics<br />
2010<br />
Rm<br />
2009<br />
Rm<br />
Year ended 31 December<br />
2008<br />
Rm<br />
2007<br />
Rm<br />
2006<br />
Rm<br />
2005<br />
Rm<br />
Number of ordinary shares traded (m) 217 291 348 251 248 294<br />
Number of transactions (’000) 283 321 308 136 90 87<br />
Value of ordinary shares traded (Rm) 19 384 27 740 54 435 31 887 18 069 15 953<br />
% of issued shares traded (Rm) 54 73 78 56 56 66<br />
Year-end market price/headline earnings ratio (times) 23.1 (99.0) 4.2 10.6 9.3 5.4<br />
Headline earnings yield at year-end (%) 4.3 (1.0) 24.1 9.4 10.8 18.6<br />
Dividend yield at year-end (%) 1.9 8.0 3.1 3.5 6.2<br />
Market price per ordinary share (cents)<br />
– year-end 7 922 10 300 8 845 13 650 9 825 6 125<br />
– highest 11 745 12 796 26500 15300 9 900 6 930<br />
– lowest 7 115 6 120 5 865 9 153 5 640 4 160<br />
– weighted average price per share trade 8 933 9 533 15 642 12 704 7 286 5 426<br />
Year-end market price/net equity per ordinary<br />
share (times) 1.41 1.88 1.41 2.96 1.88 1.40<br />
Market capitalisation at year-end (Rm) 31 783 41 324 39 427 60 845 43 795 27 302<br />
<strong>ArcelorMittal</strong> share price index (base: 2004=0) 129 157 307 474 341 213<br />
JSE Actuaries index – Industrial (base 2004=0) 167 221 246 299 259 188<br />
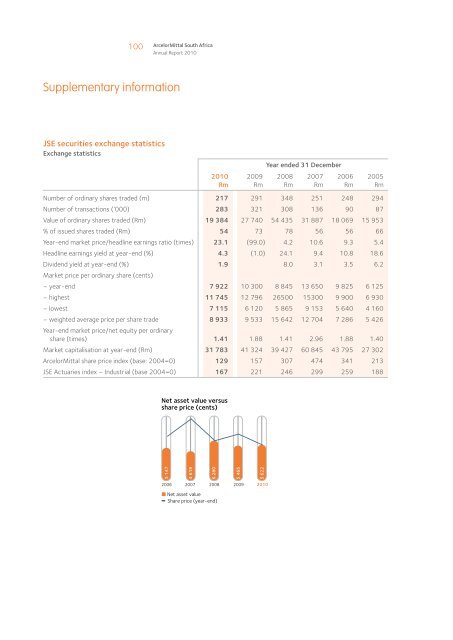
Net asset value versus<br />
share price (cents)<br />
5 147<br />
4 618<br />
6 280<br />
2006 2007 2008 2009 2010<br />
Net asset value<br />
Share price (year-end)<br />
5 465<br />
5 622