bold spirit - ArcelorMittal South Africa
bold spirit - ArcelorMittal South Africa
bold spirit - ArcelorMittal South Africa

Create successful ePaper yourself
Turn your PDF publications into a flip-book with our unique Google optimized e-Paper software.
103<br />
<strong>ArcelorMittal</strong> <strong>South</strong> <strong>Africa</strong><br />
Annual Report 2010<br />
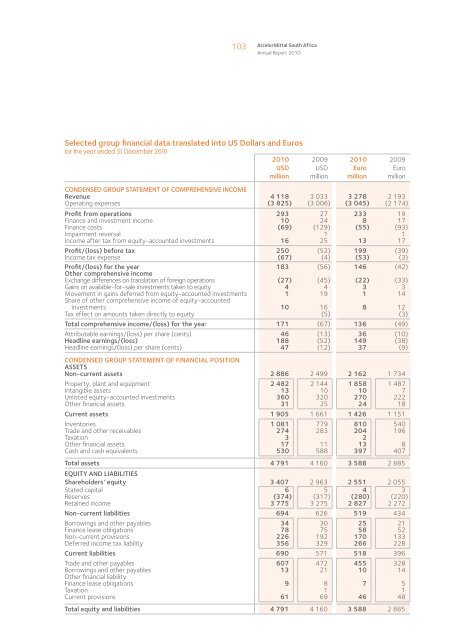
Selected group financial data translated into US Dollars and Euros<br />
for the year ended 31 December 2010<br />
2010<br />
USD<br />
million<br />
2009<br />
USD<br />
million<br />
2010<br />
Euro<br />
million<br />
2009<br />
Euro<br />
million<br />
CONDENSED GROUP STATEMENT OF COMPREHENSIVE INCOME<br />
Revenue 4 118 3 033 3 278 2 193<br />
Operating expenses (3 825) (3 006) (3 045) (2 174)<br />
Profit from operations 293 27 233 19<br />
Finance and investment income 10 24 8 17<br />
Finance costs (69) (129) (55) (93)<br />
Impairment reversal 1 1<br />
Income after tax from equity-accounted investments 16 25 13 17<br />
Profit/(loss) before tax 250 (52) 199 (39)<br />
Income tax expense (67) (4) (53) (3)<br />
Profit/(loss) for the year 183 (56) 146 (42)<br />
Other comprehensive income<br />
Exchange differences on translation of foreign operations (27) (45) (22) (33)<br />
Gains on available-for-sale investments taken to equity 4 4 3 3<br />
Movement in gains deferred from equity-accounted investments 1 19 1 14<br />
Share of other comprehensive income of equity-accounted<br />
investments 10 16 8 12<br />
Tax effect on amounts taken directly to equity (5) (3)<br />
Total comprehensive income/(loss) for the year 171 (67) 136 (49)<br />
Attributable earnings/(loss) per share (cents) 46 (13) 36 (10)<br />
Headline earnings/(loss) 188 (52) 149 (38)<br />
Headline earnings/(loss) per share (cents) 47 (12) 37 (9)<br />
CONDENSED GROUP STATEMENT OF FINANCIAL POSITION<br />
ASSETS<br />
Non-current assets 2 886 2 499 2 162 1 734<br />
Property, plant and equipment 2 482 2 144 1 858 1 487<br />
Intangible assets 13 10 10 7<br />
Unlisted equity-accounted investments 360 320 270 222<br />
Other financial assets 31 25 24 18<br />
Current assets 1 905 1 661 1 426 1 151<br />
Inventories 1 081 779 810 540<br />
Trade and other receivables 274 283 204 196<br />
Taxation 3 2<br />
Other financial assets 17 11 13 8<br />
Cash and cash equivalents 530 588 397 407<br />
Total assets 4 791 4 160 3 588 2 885<br />
EQUITY AND LIABILITIES<br />
Shareholders’ equity 3 407 2 963 2 551 2 055<br />
Stated capital 6 5 4 3<br />
Reserves (374) (317) (280) (220)<br />
Retained income 3 775 3 275 2 827 2 272<br />
Non-current liabilities 694 626 519 434<br />
Borrowings and other payables 34 30 25 21<br />
Finance lease obligations 78 75 58 52<br />
Non-current provisions 226 192 170 133<br />
Deferred income tax liability 356 329 266 228<br />
Current liabilities 690 571 518 396<br />
Trade and other payables 607 472 455 328<br />
Borrowings and other payables 13 21 10 14<br />
Other financial liability<br />
Finance lease obligations 9 8 7 5<br />
Taxation 1 1<br />
Current provisions 61 69 46 48<br />
Total equity and liabilities 4 791 4 160 3 588 2 885