bold spirit - ArcelorMittal South Africa
bold spirit - ArcelorMittal South Africa
bold spirit - ArcelorMittal South Africa

You also want an ePaper? Increase the reach of your titles
YUMPU automatically turns print PDFs into web optimized ePapers that Google loves.
179<br />
<strong>ArcelorMittal</strong> <strong>South</strong> <strong>Africa</strong><br />
Annual Report 2010<br />
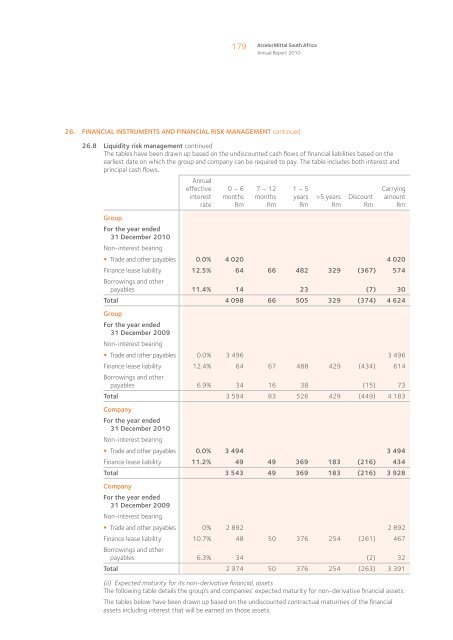
26. FINANCIAL INSTRUMENTS AND FINANCIAL RISK MANAGEMENT continued<br />
26.8 Liquidity risk management continued<br />
The tables have been drawn up based on the undiscounted cash flows of financial liabilities based on the<br />
earliest date on which the group and company can be required to pay. The table includes both interest and<br />
principal cash flows.<br />
Annual<br />
effective<br />
interest<br />
rate<br />
0 – 6<br />
months<br />
Rm<br />
7 – 12<br />
months<br />
Rm<br />
1 – 5<br />
years<br />
Rm<br />
>5 years<br />
Rm<br />
Discount<br />
Rm<br />
Carrying<br />
amount<br />
Rm<br />
Group<br />
For the year ended<br />
31 December 2010<br />
Non-interest bearing<br />
• Trade and other payables 0.0% 4 020 4 020<br />
Finance lease liability 12.5% 64 66 482 329 (367) 574<br />
Borrowings and other<br />
payables 11.4% 14 23 (7) 30<br />
Total 4 098 66 505 329 (374) 4 624<br />
Group<br />
For the year ended<br />
31 December 2009<br />
Non-interest bearing<br />
• Trade and other payables 0.0% 3 496 3 496<br />
Finance lease liability 12.4% 64 67 488 429 (434) 614<br />
Borrowings and other<br />
payables 6.9% 34 16 38 (15) 73<br />
Total 3 594 83 526 429 (449) 4 183<br />
Company<br />
For the year ended<br />
31 December 2010<br />
Non-interest bearing<br />
• Trade and other payables 0.0% 3 494 3 494<br />
Finance lease liability 11.2% 49 49 369 183 (216) 434<br />
Total 3 543 49 369 183 (216) 3 928<br />
Company<br />
For the year ended<br />
31 December 2009<br />
Non-interest bearing<br />
• Trade and other payables 0% 2 892 2 892<br />
Finance lease liability 10.7% 48 50 376 254 (261) 467<br />
Borrowings and other<br />
payables 6.3% 34 (2) 32<br />
Total 2 974 50 376 254 (263) 3 391<br />
(ii) Expected maturity for its non-derivative financial, assets<br />
The following table details the group’s and companies’ expected maturity for non-derivative financial assets.<br />
The tables below have been drawn up based on the undiscounted contractual maturities of the financial<br />
assets including interest that will be earned on those assets.