

Draft MTP/SCS Comments Received - sacog
Draft MTP/SCS Comments Received - sacog
Draft MTP/SCS Comments Received - sacog

Create successful ePaper yourself
Turn your PDF publications into a flip-book with our unique Google optimized e-Paper software.
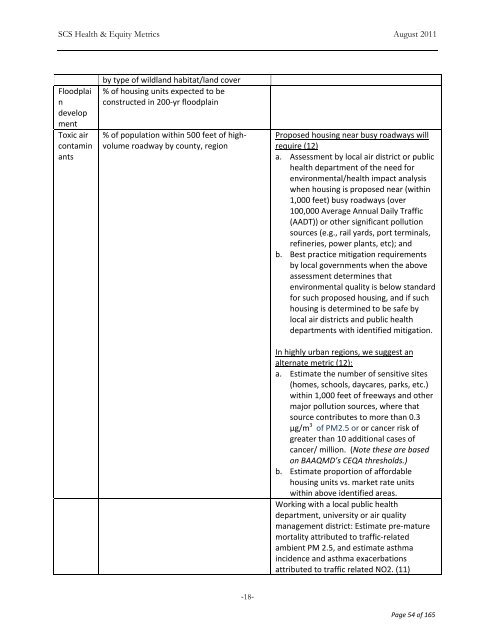
<strong>SCS</strong> Health & Equity Metrics August 2011<br />
Floodplai<br />
n<br />
develop<br />
ment<br />
Toxic air<br />
contamin<br />
ants<br />
by type of wildland habitat/land cover<br />
% of housing units expected to be<br />
constructed in 200‐yr floodplain<br />
% of population within 500 feet of highvolume<br />
roadway by county, region<br />
Proposed housing near busy roadways will<br />
require (12)<br />
a. Assessment by local air district or public<br />
health department of the need for<br />
environmental/health impact analysis<br />
when housing is proposed near (within<br />
1,000 feet) busy roadways (over<br />
100,000 Average Annual Daily Traffic<br />
(AADT)) or other significant pollution<br />
sources (e.g., rail yards, port terminals,<br />
refineries, power plants, etc); and<br />
b. Best practice mitigation requirements<br />
by local governments when the above<br />
assessment determines that<br />
environmental quality is below standard<br />
for such proposed housing, and if such<br />
housing is determined to be safe by<br />
local air districts and public health<br />
departments with identified mitigation.<br />
In highly urban regions, we suggest an<br />
alternate metric (12):<br />
a. Estimate the number of sensitive sites<br />
(homes, schools, daycares, parks, etc.)<br />
within 1,000 feet of freeways and other<br />
major pollution sources, where that<br />
source contributes to more than 0.3<br />
μg/m 3 of PM2.5 or or cancer risk of<br />
greater than 10 additional cases of<br />
cancer/ million. (Note these are based<br />
on BAAQMD’s CEQA thresholds.)<br />
b. Estimate proportion of affordable<br />
housing units vs. market rate units<br />
within above identified areas.<br />
Working with a local public health<br />
department, university or air quality<br />
management district: Estimate pre‐mature<br />
mortality attributed to traffic‐related<br />
ambient PM 2.5, and estimate asthma<br />
incidence and asthma exacerbations<br />
attributed to traffic related NO2. (11)<br />
‐18‐<br />
Page 54 of 165


