Volume 6, Spring 2008 - Saddleback College
Volume 6, Spring 2008 - Saddleback College
Volume 6, Spring 2008 - Saddleback College

You also want an ePaper? Increase the reach of your titles
YUMPU automatically turns print PDFs into web optimized ePapers that Google loves.
Fall 2007 Biology 3A Abstracts<br />
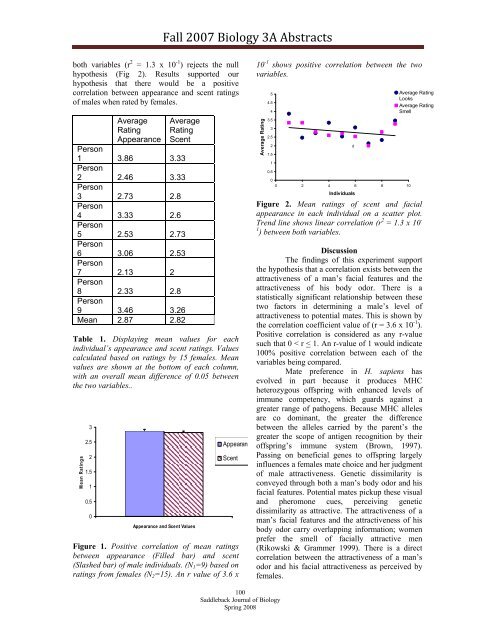
both variables (r 2 = 1.3 x 10 -1 ) rejects the null<br />
hypothesis (Fig 2). Results supported our<br />
hypothesis that there would be a positive<br />
correlation between appearance and scent ratings<br />
of males when rated by females.<br />
Average<br />
Rating<br />
Appearance<br />
Average<br />
Rating<br />
Scent<br />
Person<br />
1 3.86 3.33<br />
Person<br />
2 2.46 3.33<br />
Person<br />
3 2.73 2.8<br />
Person<br />
4 3.33 2.6<br />
Person<br />
5 2.53 2.73<br />
Person<br />
6 3.06 2.53<br />
Person<br />
7 2.13 2<br />
Person<br />
8 2.33 2.8<br />
Person<br />
9 3.46 3.26<br />
Mean 2.87 2.82<br />
Table 1. Displaying mean values for each<br />
individual’s appearance and scent ratings. Values<br />
calculated based on ratings by 15 females. Mean<br />
values are shown at the bottom of each column,<br />
with an overall mean difference of 0.05 between<br />
the two variables..<br />
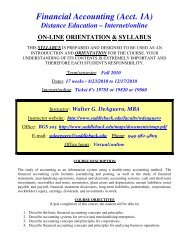
Mean Ratings<br />
3<br />
2.5<br />
2<br />
1.5<br />
1<br />
0.5<br />
0<br />
1<br />
Appearance and Scent Values<br />
Appearan<br />
Scent<br />
Figure 1. Positive correlation of mean ratings<br />
between appearance (Filled bar) and scent<br />
(Slashed bar) of male individuals. (N 1 =9) based on<br />
ratings from females (N 2 =15). An r value of 3.6 x<br />
10 -1 shows positive correlation between the two<br />
variables.<br />
Average Rating<br />
5<br />
4.5<br />
4<br />
3.5<br />
3<br />
2.5<br />
2<br />
1.5<br />
1<br />
0.5<br />
0<br />
0 2 4 6 8 10<br />
Individuals<br />
Figure 2. Mean ratings of scent and facial<br />
appearance in each individual on a scatter plot.<br />
Trend line shows linear correlation (r 2 = 1.3 x 10 -<br />
1 ) between both variables.<br />
Discussion<br />
The findings of this experiment support<br />
the hypothesis that a correlation exists between the<br />
attractiveness of a man’s facial features and the<br />
attractiveness of his body odor. There is a<br />
statistically significant relationship between these<br />
two factors in determining a male’s level of<br />
attractiveness to potential mates. This is shown by<br />
the correlation coefficient value of (r = 3.6 x 10 -1 ).<br />
Positive correlation is considered as any r-value<br />
such that 0 < r < 1. An r-value of 1 would indicate<br />
100% positive correlation between each of the<br />
variables being compared.<br />
Mate preference in H. sapiens has<br />
evolved in part because it produces MHC<br />
heterozygous offspring with enhanced levels of<br />
immune competency, which guards against a<br />
greater range of pathogens. Because MHC alleles<br />
are co dominant, the greater the difference<br />
between the alleles carried by the parent’s the<br />
greater the scope of antigen recognition by their<br />
offspring’s immune system (Brown, 1997).<br />
Passing on beneficial genes to offspring largely<br />
influences a females mate choice and her judgment<br />
of male attractiveness. Genetic dissimilarity is<br />
conveyed through both a man’s body odor and his<br />
facial features. Potential mates pickup these visual<br />
and pheromone cues, perceiving genetic<br />
dissimilarity as attractive. The attractiveness of a<br />
man’s facial features and the attractiveness of his<br />
body odor carry overlapping information; women<br />
prefer the smell of facially attractive men<br />
(Rikowski & Grammer 1999). There is a direct<br />
correlation between the attractiveness of a man’s<br />
odor and his facial attractiveness as perceived by<br />
females.<br />
d<br />
Average Rating<br />
Looks<br />
Average Rating<br />
Smell<br />
100<br />
<strong>Saddleback</strong> Journal of Biology<br />
<strong>Spring</strong> <strong>2008</strong>