Volume 6, Spring 2008 - Saddleback College
Volume 6, Spring 2008 - Saddleback College
Volume 6, Spring 2008 - Saddleback College

Create successful ePaper yourself
Turn your PDF publications into a flip-book with our unique Google optimized e-Paper software.
Fall 2007 Biology 3A Abstracts<br />
turbidity depends on available light, rather than<br />
nutrients limiting phytoplankton growth.<br />
Large amounts of nitrate ions and phosphate<br />
gases may cause eutrophication, an excess of<br />
nutrients resulting in the abundance of photosynthetic<br />
algae and plankton causing a serious effect on the<br />
marine organisms’ life. Domoic acid (C 15 H 21 NO 6 ) is<br />
a naturally occurring amino acid phycotoxin<br />
produced by algae and plankton in all marine coasts<br />
(Pan et al, <strong>2008</strong>). This extreme chemical<br />
proliferation is triggered by temperature in seasonal<br />
algae blooms during the months of March and June<br />
contaminating phytoplankton, shellfish and sardines<br />
which later poison lipid rich sea mammals. California<br />
sea lions are primarily affected by domoic acid; this<br />
neurotoxin attacks the hippocampus part of their<br />
brain causing memory loss, blindness and seizures<br />
that will lead to death. Borchelt (1997) has a handful<br />
of possible explanations for the increase of toxic<br />
tides: increase in the amount of nitrogen gas,<br />
phosphorus gas and other nutrients are disposed from<br />
land fertilizers and animal waste; sewage and effluent<br />
pollution in oceans.<br />
Temperature, salinity, wave conditions, sea<br />
levels caused by high tide and low tide influence<br />
phytoplankton activity- Nitrogen gas and Phosphate<br />
ion levels are well known to increase phytoplankton<br />
concentrations in ocean waters (Lehman, 2006).<br />
Therefore, in this study, nitrogen gas and phosphate<br />
ion levels are being tested to determine the<br />
relationship between tides and the abundance of<br />
phytoplankton which lead to severe toxin<br />
concentrations.<br />
Materials and Methods<br />
This experiment was conducted over a period<br />
of three days in April of <strong>2008</strong>. Water samples were<br />
collected behind the Ocean Institute at the Dana Point<br />
Harbor in Southern California and the analysis were<br />
performed in the laboratory at <strong>Saddleback</strong> <strong>College</strong>,<br />
Mission Viejo, CA. On Sunday April 6, <strong>2008</strong>, three<br />
sterilized bottles were used to collect sea water<br />
during high tide. According to <strong>2008</strong> Dana Point<br />
Harbors Tide Calendar, high tide was at 9:30 am with<br />
a 4.7 MSL (mean sea level) which are recorded by<br />
stationed tide clocks and gauges. The bottles were<br />
then placed in a refrigerator to prevent bacterial<br />
growth. Later that day at 3:50 pm three other<br />
sterilized bottles were used to collect water samples<br />
during low tide, 0.6 MSL. The samples were also<br />
placed refrigerator to obtain accurate results. Samples<br />
were taken to laboratory to examine on April 7,<br />
<strong>2008</strong>.<br />
A DR/850 Colorimeter (Hach Company, CO.<br />
U.S.A) was used to measure the concentration of<br />
dissolved nitrate ions and phosphate ions in the water<br />
samples. This devise had several settings and packets<br />
that contain compounds that create a reaction; a blank<br />
test tube with sample water was always needed to<br />
calibrate the calorimeter between readings. Nitrogen<br />
was first tested, with a Nitra Ver 5 Nitrate packet<br />
mainly containing: Cadmium, Gentisic Acid,<br />
Magnesium Sulfate, Potassium Phosphate,<br />
Monobasic and Sulfanilic Acid. Using the low tide<br />
samples ten mL of sea water was placed into three<br />
special glass bottles with the Ver 5 Nitrate packets,<br />
they were shaken vigorously for one minute and were<br />
set aside for five minutes while the Colorimeter read<br />
the blank sample which was then zeroed out (0.0<br />
mg/L No3-N). The water samples were also tested for<br />
Phosphorus; a 3 Phosphate Reagent packet was used<br />
that contains: Ascorbic Acid, Potassium Pyrosulfate<br />
and Sodium Molybdate. Using low tide samples, 10<br />
mL of each bottle was placed in three special bottles<br />
that the colorimeter could read. Phos Ver 3 powder<br />
was added to each test tube, shaken for 15 seconds,<br />
were then left to stand for two minutes to allow the<br />
reaction occur. The blank tube was placed in the<br />
colorimeter to zero out (0.0 mg/L P04). Each water<br />
sample was placed in the device to be read.<br />
For both nitrogen gas and phosphorus gas, the<br />
average concentrations of the three measurements<br />
were recorded by summing all the three values and<br />
dividing by three. Those average values were<br />
demonstrated on bar graphs using Microsoft Excel<br />
2007 to compare the concentration differences at low<br />
tide and high tide.<br />
Results<br />
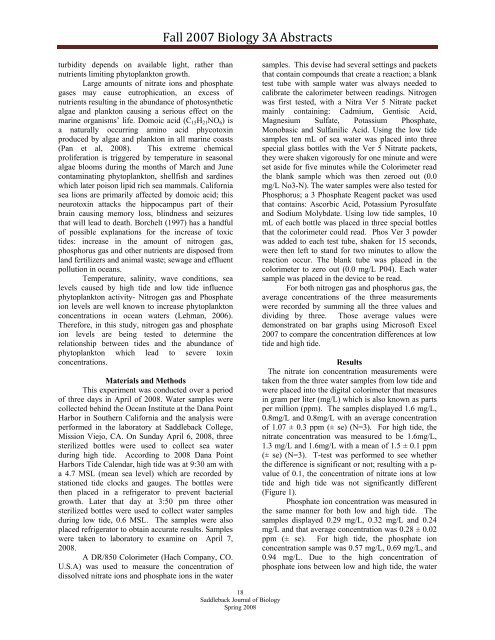
The nitrate ion concentration measurements were<br />
taken from the three water samples from low tide and<br />
were placed into the digital colorimeter that measures<br />
in gram per liter (mg/L) which is also known as parts<br />
per million (ppm). The samples displayed 1.6 mg/L,<br />
0.8mg/L and 0.8mg/L with an average concentration<br />
of 1.07 ± 0.3 ppm (± se) (N=3). For high tide, the<br />
nitrate concentration was measured to be 1.6mg/L,<br />
1.3 mg/L and 1.6mg/L with a mean of 1.5 ± 0.1 ppm<br />
(± se) (N=3). T-test was performed to see whether<br />
the difference is significant or not; resulting with a p-<br />
value of 0.1, the concentration of nitrate ions at low<br />
tide and high tide was not significantly different<br />
(Figure 1).<br />
Phosphate ion concentration was measured in<br />
the same manner for both low and high tide. The<br />
samples displayed 0.29 mg/L, 0.32 mg/L and 0.24<br />
mg/L and that average concentration was 0.28 ± 0.02<br />
ppm (± se). For high tide, the phosphate ion<br />
concentration sample was 0.57 mg/L, 0.69 mg/L, and<br />
0.94 mg/L. Due to the high concentration of<br />
phosphate ions between low and high tide, the water<br />
18<br />
<strong>Saddleback</strong> Journal of Biology<br />
<strong>Spring</strong> <strong>2008</strong>