Volume 6, Spring 2008 - Saddleback College
Volume 6, Spring 2008 - Saddleback College
Volume 6, Spring 2008 - Saddleback College

Create successful ePaper yourself
Turn your PDF publications into a flip-book with our unique Google optimized e-Paper software.
Fall 2007 Biology 3A Abstracts<br />
with the equation of the line and the R 2 value (Fig 2).<br />
The slope of the line represented the metabolic rate in<br />
different units. The slope (ppm/sec) was multiplied by<br />
the total time the roaches remained in the container to<br />
make the value a measurement only of CO 2 per million<br />
molecules of air:<br />
Slope ppm/sec Time sec = [CO 2 ] ppm<br />
To determine the number of moles of CO 2<br />
within the volume of air in the container, a ratio was<br />
set between the ppm of CO 2 per million molecules of<br />
air:<br />
Parts of CO 2 = Moles of CO 2<br />
Parts of Air Moles of Air<br />
The moles of CO 2 were applied to the Ideal Gas Law to<br />
calculate the volume (L) of CO 2 :<br />
PV = nRT V = nRT<br />
P<br />
The volume of CO 2 produced was converted<br />
to milliliters (mL), divided by the body mass (g) of<br />
each roach, and divided by the duration of the trial<br />
(sec), ultimately yielding the metabolic rate (mL/g/sec)<br />
or (mLg -1 sec -1 ). Calculations were applied to all<br />
roaches and their averages for the three temperatures.<br />
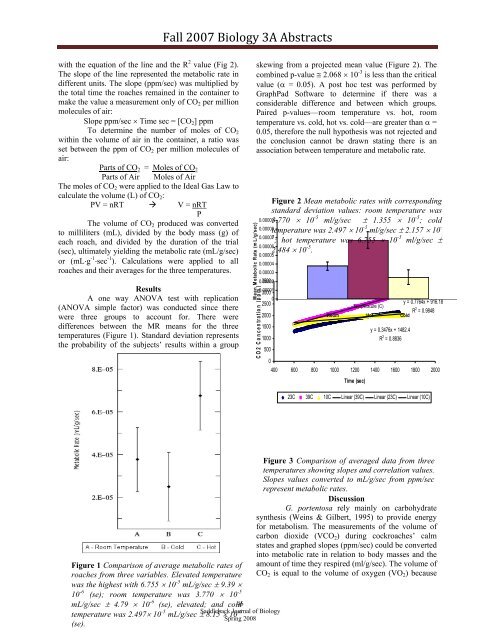
Results<br />
A one way ANOVA test with replication<br />
(ANOVA simple factor) was conducted since there<br />
were three groups to account for. There were<br />
differences between the MR means for the three<br />
temperatures (Figure 1). Standard deviation represents<br />
the probability of the subjects’ results within a group<br />
skewing from a projected mean value (Figure 2). The<br />
combined p-value 2.068 10 -3 is less than the critical<br />
value ( = 0.05). A post hoc test was performed by<br />
GraphPad Software to determine if there was a<br />
considerable difference and between which groups.<br />
Paired p-values—room temperature vs. hot, room<br />
temperature vs. cold, hot vs. cold—are greater than =<br />
0.05, therefore the null hypothesis was not rejected and<br />
the conclusion cannot be drawn stating there is an<br />
association between temperature and metabolic rate.<br />
Mean Metabolic Rate (m L/g/sec)<br />
CO2 Concentration (p p m )<br />
0.00009<br />
0.00008<br />
0.00007<br />
0.00006<br />
0.00005<br />
0.00004<br />
0.00003<br />
0.00002 3500<br />
0.00001<br />
3000<br />
0<br />
2500<br />
2000<br />
1500<br />
1000<br />
500<br />
Figure 2 Mean metabolic rates with corresponding<br />
standard deviation values: room temperature was<br />
3.770 10 -5 ml/g/sec 1.355 10 -5 ; cold<br />
temperature was 2.497 10 -5 ml/g/sec 2.157 10 -<br />
5 ; hot temperature was 6.755 10 -5 ml/g/sec <br />
2.484 10 -5 .<br />
y = 1.2545x + 850.1<br />
R 2 = 0.9984<br />
y = 0.7764x + 916.18<br />
Temperature (C)<br />
R 2 = 0.9848<br />
Room Hot Cold<br />
y = 0.3476x + 1482.4<br />
R 2 = 0.8836<br />
0<br />
400 600 800 1000 1200 1400 1600 1800 2000<br />
Time (sec)<br />
23C 39C 10C Linear (39C) Linear (23C) Linear (10C)<br />
Figure 1 Comparison of average metabolic rates of<br />
roaches from three variables. Elevated temperature<br />
was the highest with 6.755 10 -5 mL/g/sec 9.39 <br />
10 -6 (se); room temperature was 3.770 10 -5<br />
mL/g/sec 4.79 10 -6 (se), elevated; and cold<br />
46<br />
<strong>Saddleback</strong> Journal of Biology<br />
<strong>Spring</strong> <strong>2008</strong><br />
temperature was 2.497 10 -5 mL/g/sec 8.15 10 -6<br />
(se).<br />
Figure 3 Comparison of averaged data from three<br />
temperatures showing slopes and correlation values.<br />
Slopes values converted to mL/g/sec from ppm/sec<br />
represent metabolic rates.<br />
Discussion<br />
G. portentosa rely mainly on carbohydrate<br />
synthesis (Weins & Gilbert, 1995) to provide energy<br />
for metabolism. The measurements of the volume of<br />
carbon dioxide (VCO 2 ) during cockroaches’ calm<br />
states and graphed slopes (ppm/sec) could be converted<br />
into metabolic rate in relation to body masses and the<br />
amount of time they respired (ml/g/sec). The volume of<br />
CO 2 is equal to the volume of oxygen (VO 2 ) because