Volume 6, Spring 2008 - Saddleback College
Volume 6, Spring 2008 - Saddleback College
Volume 6, Spring 2008 - Saddleback College

You also want an ePaper? Increase the reach of your titles
YUMPU automatically turns print PDFs into web optimized ePapers that Google loves.
38<br />
<strong>Saddleback</strong> Journal of Biology<br />
<strong>Spring</strong> <strong>2008</strong><br />
Fall 2007 Biology 3A Abstracts<br />
Gas Production (ml)<br />
0.9<br />
0.8<br />
0.7<br />
0.6<br />
0.5<br />
0.4<br />
0.3<br />
0.2<br />
0.1<br />
0<br />
pH1 pH3 pH5 pH7 pH9<br />
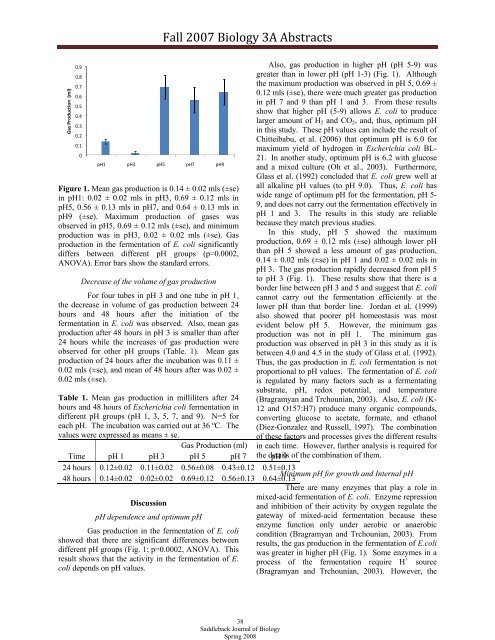
Figure 1. Mean gas production is 0.14 ± 0.02 mls (±se)<br />
in pH1: 0.02 ± 0.02 mls in pH3, 0.69 ± 0.12 mls in<br />
pH5, 0.56 ± 0.13 mls in pH7, and 0.64 ± 0.13 mls in<br />
pH9 (±se). Maximum production of gases was<br />
observed in pH5, 0.69 ± 0.12 mls (±se), and minimum<br />
production was in pH3, 0.02 ± 0.02 mls (±se). Gas<br />
production in the fermentation of E. coli significantly<br />
differs between different pH groups (p=0.0002,<br />
ANOVA). Error bars show the standard errors.<br />
Decrease of the volume of gas production<br />
For four tubes in pH 3 and one tube in pH 1,<br />
the decrease in volume of gas production between 24<br />
hours and 48 hours after the initiation of the<br />
fermentation in E. coli was observed. Also, mean gas<br />
production after 48 hours in pH 3 is smaller than after<br />
24 hours while the increases of gas production were<br />
observed for other pH groups (Table. 1). Mean gas<br />
production of 24 hours after the incubation was 0.11 ±<br />
0.02 mls (±se), and mean of 48 hours after was 0.02 ±<br />
0.02 mls (±se).<br />
Table 1. Mean gas production in milliliters after 24<br />
hours and 48 hours of Escherichia coli fermentation in<br />
different pH groups (pH 1, 3, 5, 7, and 9). N=5 for<br />
each pH. The incubation was carried out at 36 ºC. The<br />
values were expressed as means ± se.<br />
Gas Production (ml)<br />
Time pH 1 pH 3 pH 5 pH 7 pH 9<br />
Also, gas production in higher pH (pH 5-9) was<br />
greater than in lower pH (pH 1-3) (Fig. 1). Although<br />
the maximum production was observed in pH 5, 0.69 ±<br />
0.12 mls (±se), there were much greater gas production<br />
in pH 7 and 9 than pH 1 and 3. From these results<br />
show that higher pH (5-9) allows E. coli to produce<br />
larger amount of H 2 and CO 2 , and, thus, optimum pH<br />
in this study. These pH values can include the result of<br />
Chitteibabu, et al. (2006) that optimum pH is 6.0 for<br />
maximum yield of hydrogen in Escherichia coli BL-<br />
21. In another study, optimum pH is 6.2 with glucose<br />
and a mixed culture (Oh et al., 2003). Furthermore,<br />
Glass et al. (1992) concluded that E. coli grew well at<br />
all alkaline pH values (to pH 9.0). Thus, E. coli has<br />
wide range of optimum pH for the fermentation, pH 5-<br />
9, and does not carry out the fermentation effectively in<br />
pH 1 and 3. The results in this study are reliable<br />
because they match previous studies.<br />
In this study, pH 5 showed the maximum<br />
production, 0.69 ± 0.12 mls (±se) although lower pH<br />
than pH 5 showed a less amount of gas production,<br />
0.14 ± 0.02 mls (±se) in pH 1 and 0.02 ± 0.02 mls in<br />
pH 3. The gas production rapidly decreased from pH 5<br />
to pH 3 (Fig. 1). These results show that there is a<br />
border line between pH 3 and 5 and suggest that E. coli<br />
cannot carry out the fermentation efficiently at the<br />
lower pH than that border line. Jordan et al. (1999)<br />
also showed that poorer pH homeostasis was most<br />
evident below pH 5. However, the minimum gas<br />
production was not in pH 1. The minimum gas<br />
production was observed in pH 3 in this study as it is<br />
between 4.0 and 4.5 in the study of Glass et al. (1992).<br />
Thus, the gas production in E. coli fermentation is not<br />
proportional to pH values. The fermentation of E. coli<br />
is regulated by many factors such as a fermentating<br />
substrate, pH, redox potential, and temperature<br />
(Bragramyan and Trchounian, 2003). Also, E. coli (K-<br />
12 and O157:H7) produce many organic compounds,<br />
converting glucose to acetate, formate, and ethanol<br />
(Diez-Gonzalez and Russell, 1997). The combination<br />
of these factors and processes gives the different results<br />
in each time. However, further analysis is required for<br />
the details of the combination of them.<br />
24 hours 0.12±0.02 0.11±0.02 0.56±0.08 0.43±0.12 0.51±0.13<br />
Minimum pH for growth and Internal pH<br />
48 hours 0.14±0.02 0.02±0.02 0.69±0.12 0.56±0.13 0.64±0.13<br />
There are many enzymes that play a role in<br />
mixed-acid fermentation of E. coli. Enzyme repression<br />
Discussion<br />
and inhibition of their activity by oxygen regulate the<br />
pH dependence and optimum pH<br />
gateway of mixed-acid fermentation because these<br />
enzyme function only under aerobic or anaerobic<br />
Gas production in the fermentation of E. coli condition (Bragramyan and Trchounian, 2003). From<br />
showed that there are significant differences between results, the gas production in the fermentation of E.coli<br />
different pH groups (Fig. 1; p=0.0002, ANOVA). This was greater in higher pH (Fig. 1). Some enzymes in a<br />
result shows that the activity in the fermentation of E. process of the fermentation require H + source<br />
coli depends on pH values.<br />
(Bragramyan and Trchounian, 2003). However, the