Volume 6, Spring 2008 - Saddleback College
Volume 6, Spring 2008 - Saddleback College
Volume 6, Spring 2008 - Saddleback College

Create successful ePaper yourself
Turn your PDF publications into a flip-book with our unique Google optimized e-Paper software.
Fall 2007 Biology 3A Abstracts<br />
to their body weight, for the control factor. For a three<br />
hour period, the participants worked on study material<br />
to expend their energy on mental stress to achieve total<br />
exhaustion, in order to simulate the working day of the<br />
average American. During this time, their reaction<br />
times were recorded at every 15 minute interval using a<br />
reaction time ruler (accurate to ± 12.5 ms). This<br />
process was repeated for the energy drink and diet<br />
energy drink trials on different days for the same six<br />
individuals; each individual had to consume equal<br />
volumes of the afore mentioned drinks as they did<br />
during the water trials.<br />
Results<br />
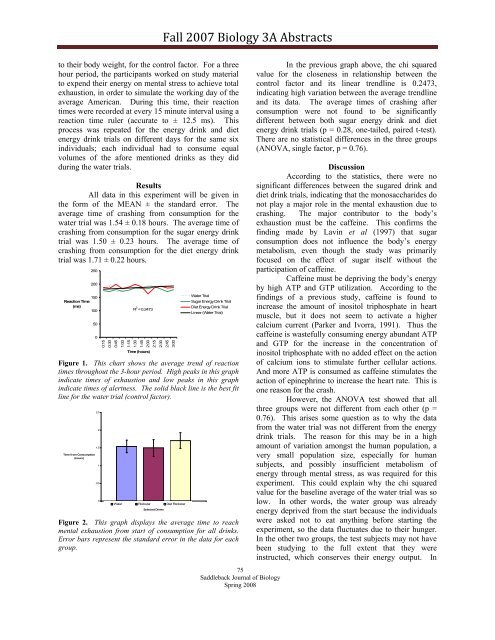
All data in this experiment will be given in<br />
the form of the MEAN ± the standard error. The<br />
average time of crashing from consumption for the<br />
water trial was 1.54 ± 0.18 hours. The average time of<br />
crashing from consumption for the sugar energy drink<br />
trial was 1.50 ± 0.23 hours. The average time of<br />
crashing from consumption for the diet energy drink<br />
trial was 1.71 ± 0.22 hours.<br />
Reaction Time<br />
(ms)<br />
250<br />
200<br />
150<br />
100<br />
50<br />
0<br />
R 2 = 0.2473<br />
0:15<br />
0:30<br />
0:45<br />
1:00<br />
1:15<br />
1:30<br />
1:45<br />
2:00<br />
2:15<br />
2:30<br />
2:45<br />
3:00<br />
Time (hours)<br />
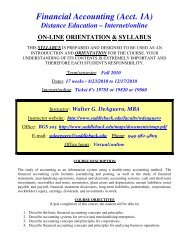
Figure 1. This chart shows the average trend of reaction<br />
times throughout the 3-hour period. High peaks in this graph<br />
indicate times of exhaustion and low peaks in this graph<br />
indicate times of alertness. The solid black line is the best fit<br />
line for the water trial (control factor).<br />
Time from Consumption<br />
(hours)<br />
2.5<br />
2<br />
1.5<br />
1<br />
0.5<br />
0<br />
Water Rockstar 1 Diet Rockstar<br />
Selected Drinks<br />
Water Trial<br />
Sugar Energy Drink Trial<br />
Diet Energy Drink Trial<br />
Linear (Water Trial)<br />
Figure 2. This graph displays the average time to reach<br />
mental exhaustion from start of consumption for all drinks.<br />
Error bars represent the standard error in the data for each<br />
group.<br />
75<br />
<strong>Saddleback</strong> Journal of Biology<br />
<strong>Spring</strong> <strong>2008</strong><br />
In the previous graph above, the chi squared<br />
value for the closeness in relationship between the<br />
control factor and its linear trendline is 0.2473,<br />
indicating high variation between the average trendline<br />
and its data. The average times of crashing after<br />
consumption were not found to be significantly<br />
different between both sugar energy drink and diet<br />
energy drink trials (p = 0.28, one-tailed, paired t-test).<br />
There are no statistical differences in the three groups<br />
(ANOVA, single factor, p = 0.76).<br />
Discussion<br />
According to the statistics, there were no<br />
significant differences between the sugared drink and<br />
diet drink trials, indicating that the monosaccharides do<br />
not play a major role in the mental exhaustion due to<br />
crashing. The major contributor to the body’s<br />
exhaustion must be the caffeine. This confirms the<br />
finding made by Lavin et al (1997) that sugar<br />
consumption does not influence the body’s energy<br />
metabolism, even though the study was primarily<br />
focused on the effect of sugar itself without the<br />
participation of caffeine.<br />
Caffeine must be depriving the body’s energy<br />
by high ATP and GTP utilization. According to the<br />
findings of a previous study, caffeine is found to<br />
increase the amount of inositol triphosphate in heart<br />
muscle, but it does not seem to activate a higher<br />
calcium current (Parker and Ivorra, 1991). Thus the<br />
caffeine is wastefully consuming energy abundant ATP<br />
and GTP for the increase in the concentration of<br />
inositol triphosphate with no added effect on the action<br />
of calcium ions to stimulate further cellular actions.<br />
And more ATP is consumed as caffeine stimulates the<br />
action of epinephrine to increase the heart rate. This is<br />
one reason for the crash.<br />
However, the ANOVA test showed that all<br />
three groups were not different from each other (p =<br />
0.76). This arises some question as to why the data<br />
from the water trial was not different from the energy<br />
drink trials. The reason for this may be in a high<br />
amount of variation amongst the human population, a<br />
very small population size, especially for human<br />
subjects, and possibly insufficient metabolism of<br />
energy through mental stress, as was required for this<br />
experiment. This could explain why the chi squared<br />
value for the baseline average of the water trial was so<br />
low. In other words, the water group was already<br />
energy deprived from the start because the individuals<br />
were asked not to eat anything before starting the<br />
experiment, so the data fluctuates due to their hunger.<br />
In the other two groups, the test subjects may not have<br />
been studying to the full extent that they were<br />
instructed, which conserves their energy output. In