Volume 6, Spring 2008 - Saddleback College
Volume 6, Spring 2008 - Saddleback College
Volume 6, Spring 2008 - Saddleback College

Create successful ePaper yourself
Turn your PDF publications into a flip-book with our unique Google optimized e-Paper software.
Fall 2007 Biology 3A Abstracts<br />
mesophylls (Pearcy & Ustin, 1984). As salt<br />
concentrations increase, the uptake of water by the<br />
plant is inhibited, thus greatly affecting processes<br />
involving respiration and photosynthesis. In some<br />
terrestrial species, transpiration is affected by increased<br />
salinity as the stomata’s water vapor conductance is<br />
decreased (Biber, 2006). The leaves of several<br />
organisms have even shown signs of damage with the<br />
slightest changes in salinity (Flowers et al., 1985).<br />
Based on these similar previous studies, it is perceived<br />
that increased salt concentrations interfere with the<br />
plant’s primary biological processes.<br />
The objective of this research was to observe<br />
the effects that salinity has on the photosynthetic rates<br />
of S. virginica. The hypothesis tested was whether the<br />
plant would have a maximum photosynthetic rate in a<br />
freshwater solution, and if a high salinity level would<br />
damage the plant. Photosynthetic rates were<br />
determined by measuring the rate of oxygen<br />
production. The plants were introduced to three<br />
different salinity levels: 0%, 3.5%, and 6.0%. All test<br />
groups were studied under the same ambient<br />
conditions. By subjecting the plants to two different<br />
saline solutions, we were able to experiment with the<br />
plant’s natural seawater environment and also one in<br />
which the salt level was significantly higher.<br />
Materials and Methods<br />
S. virginica were obtained from the marshes in<br />
Newport, California. The plants were cut at the stems,<br />
leaving the lateral branches intact. Each plant was<br />
weighed out to 10 g to ensure uniform mass for all<br />
samples.<br />
Each of the saline solutions was prepared in a<br />
beaker using ordinary table salt (NaCl) and distilled<br />
water. The concentrations prepared were 0%, 3.5%,<br />
and 6.0%. Prior to the experiment, the plants were<br />
immersed in their respective solutions and left to<br />
acclimate for a period of thirty minutes. One hundred<br />
watt lamps provided a light source for the plants. The<br />
lamps were placed forty inches away from the beakers.<br />
To measure the photosynthetic rates, data<br />
loggers equipped with oxygen meters (Pasco TM PS-<br />
2002) were used. After the plants had been given time<br />
to adjust to their environments, the oxygen probes were<br />
inserted into the beakers and data collecting began.<br />
Plants were then left in the controlled setting for a onehour<br />
period. Oxygen production rates were measured<br />
in mg/L by the data logger device. At the conclusion of<br />
each test period, the maximum, minimum, and average<br />
oxygen production levels were recorded. A total of four<br />
tests were performed for each solution group.<br />
Results<br />
Oxygen production by S. virginica was<br />
observed with all groups throughout the experimental<br />
Oxygen Production (mg/L)<br />
0.8<br />
0.7<br />
0.6<br />
0.5<br />
0.4<br />
0.3<br />
0.2<br />
0.1<br />
57<br />
<strong>Saddleback</strong> Journal of Biology<br />
<strong>Spring</strong> <strong>2008</strong><br />
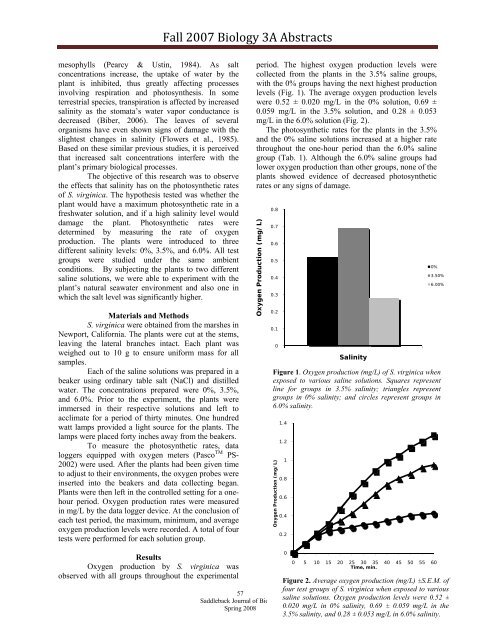
period. The highest oxygen production levels were<br />
collected from the plants in the 3.5% saline groups,<br />
with the 0% groups having the next highest production<br />
levels (Fig. 1). The average oxygen production levels<br />
were 0.52 ± 0.020 mg/L in the 0% solution, 0.69 ±<br />
0.059 mg/L in the 3.5% solution, and 0.28 ± 0.053<br />
mg/L in the 6.0% solution (Fig. 2).<br />
The photosynthetic rates for the plants in the 3.5%<br />
and the 0% saline solutions increased at a higher rate<br />
throughout the one-hour period than the 6.0% saline<br />
group (Tab. 1). Although the 6.0% saline groups had<br />
lower oxygen production than other groups, none of the<br />
plants showed evidence of decreased photosynthetic<br />
rates or any signs of damage.<br />
0<br />
Oxygen Production (mg/L)<br />
in<br />
the<br />
1.4<br />
1.2<br />
1<br />
0.8<br />
0.6<br />
0.4<br />
0.2<br />
0<br />
Salinity<br />
\when exposed to<br />
various saline<br />
solutions.<br />
0%<br />
Oxygen<br />
production<br />
3.50%<br />
6.00%<br />
Figure 1. Oxygen production (mg/L) of S. virginica when<br />
exposed to various saline solutions. Squares represent<br />
line for groups in 3.5% salinity; triangles represent<br />
groups in 0% salinity; and circles represent groups in<br />
6.0% salinity.<br />
levels were 0.52 ± 0.020 mg/L in 0%<br />
salinity,<br />
0.69 ±<br />
0.059 mg/L in the 3.5%<br />
solution, and 0.28 ± 0.053 mg/L<br />
0 5 10 15 20 25 30 35 40 45 50 55 60<br />
Time, min.<br />
Figure 2. Average oxygen production (mg/L) ±S.E.M. of<br />
four test groups of S. virginica when exposed to various<br />
saline solutions. Oxygen production levels were 0.52 ±<br />
0.020 mg/L in 0% salinity, 0.69 ± 0.059 mg/L in the<br />
3.5% salinity, and 0.28 ± 0.053 mg/L in 6.0% salinity.