Volume 6, Spring 2008 - Saddleback College
Volume 6, Spring 2008 - Saddleback College
Volume 6, Spring 2008 - Saddleback College
You also want an ePaper? Increase the reach of your titles
YUMPU automatically turns print PDFs into web optimized ePapers that Google loves.
Fall 2007 Biology 3A Abstracts<br />
species of insects remain relatively unknown. The<br />
amount of oxygen input or carbon dioxide output in a<br />
resting state may differ substantially than a flying form<br />
of locomotion, contributed by factors such as dietary<br />
energy content or temperature, even among species of<br />
similar body masses. However, there is a direct<br />
relationship between metabolic rate and body mass:<br />
metabolic rate per gram of body mass decreases with<br />
mass by a power less than 1.0 (Mueller & Diamond,<br />
2001), therefore the total metabolic rate of an animal<br />
increases proportionally with mass.<br />
Gromphadorhina portentosa is a species of<br />
large hissing cockroaches originating from<br />
Madagascar. No published previous experiments have<br />
been conducted on metabolic rates of this species.<br />
Gathering information about furtive, hissing roaches<br />
could offer insight for the comparison of energy costs<br />
of a more diverse range of insects.<br />
Materials and Methods<br />
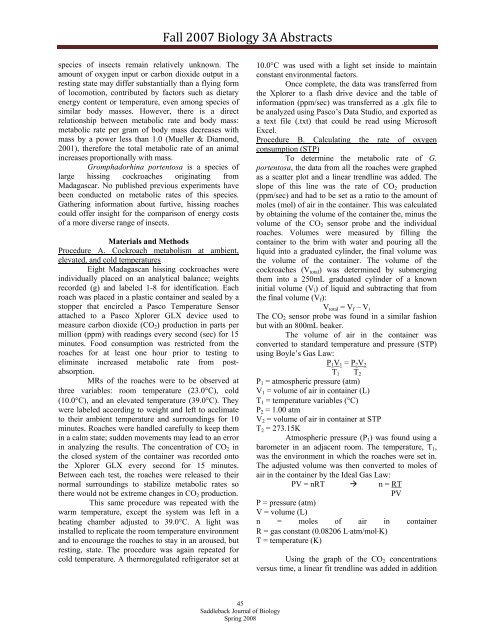
Procedure A. Cockroach metabolism at ambient,<br />
elevated, and cold temperatures<br />
Eight Madagascan hissing cockroaches were<br />
individually placed on an analytical balance; weights<br />
recorded (g) and labeled 1-8 for identification. Each<br />
roach was placed in a plastic container and sealed by a<br />
stopper that encircled a Pasco Temperature Sensor<br />
attached to a Pasco Xplorer GLX device used to<br />
measure carbon dioxide (CO 2 ) production in parts per<br />
million (ppm) with readings every second (sec) for 15<br />
minutes. Food consumption was restricted from the<br />
roaches for at least one hour prior to testing to<br />
eliminate increased metabolic rate from postabsorption.<br />
MRs of the roaches were to be observed at<br />
three variables: room temperature (23.0C), cold<br />
(10.0C), and an elevated temperature (39.0C). They<br />
were labeled according to weight and left to acclimate<br />
to their ambient temperature and surroundings for 10<br />
minutes. Roaches were handled carefully to keep them<br />
in a calm state; sudden movements may lead to an error<br />
in analyzing the results. The concentration of CO 2 in<br />
the closed system of the container was recorded onto<br />
the Xplorer GLX every second for 15 minutes.<br />
Between each test, the roaches were released to their<br />
normal surroundings to stabilize metabolic rates so<br />
there would not be extreme changes in CO 2 production.<br />
This same procedure was repeated with the<br />
warm temperature, except the system was left in a<br />
heating chamber adjusted to 39.0C. A light was<br />
installed to replicate the room temperature environment<br />
and to encourage the roaches to stay in an aroused, but<br />
resting, state. The procedure was again repeated for<br />
cold temperature. A thermoregulated refrigerator set at<br />
10.0C was used with a light set inside to maintain<br />
constant environmental factors.<br />
Once complete, the data was transferred from<br />
the Xplorer to a flash drive device and the table of<br />
information (ppm/sec) was transferred as a .glx file to<br />
be analyzed using Pasco’s Data Studio, and exported as<br />
a text file (.txt) that could be read using Microsoft<br />
Excel.<br />
Procedure B. Calculating the rate of oxygen<br />
consumption (STP)<br />
To determine the metabolic rate of G.<br />
portentosa, the data from all the roaches were graphed<br />
as a scatter plot and a linear trendline was added. The<br />
slope of this line was the rate of CO 2 production<br />
(ppm/sec) and had to be set as a ratio to the amount of<br />
moles (mol) of air in the container. This was calculated<br />
by obtaining the volume of the container the, minus the<br />
volume of the CO 2 sensor probe and the individual<br />
roaches. <strong>Volume</strong>s were measured by filling the<br />
container to the brim with water and pouring all the<br />
liquid into a graduated cylinder, the final volume was<br />
the volume of the container. The volume of the<br />
cockroaches (V total ) was determined by submerging<br />
them into a 250mL graduated cylinder of a known<br />
initial volume (V i ) of liquid and subtracting that from<br />
the final volume (V f ):<br />
V total = V f – V i<br />
The CO 2 sensor probe was found in a similar fashion<br />
but with an 800mL beaker.<br />
The volume of air in the container was<br />
converted to standard temperature and pressure (STP)<br />
using Boyle’s Gas Law:<br />
P 1 V 1 = P 2 V 2<br />
T 1 T 2<br />
P 1 = atmospheric pressure (atm)<br />
V 1 = volume of air in container (L)<br />
T 1 = temperature variables (C)<br />
P 2 = 1.00 atm<br />
V 2 = volume of air in container at STP<br />
T 2 = 273.15K<br />
Atmospheric pressure (P 1 ) was found using a<br />
barometer in an adjacent room. The temperature, T 1 ,<br />
was the environment in which the roaches were set in.<br />
The adjusted volume was then converted to moles of<br />
air in the container by the Ideal Gas Law:<br />
PV = nRT n = RT<br />
PV<br />
P = pressure (atm)<br />
V = volume (L)<br />
n = moles of air in container<br />
R = gas constant (0.08206 Latm/molK)<br />
T = temperature (K)<br />
Using the graph of the CO 2 concentrations<br />
versus time, a linear fit trendline was added in addition<br />
45<br />
<strong>Saddleback</strong> Journal of Biology<br />
<strong>Spring</strong> <strong>2008</strong>


