Volume 6, Spring 2008 - Saddleback College
Volume 6, Spring 2008 - Saddleback College
Volume 6, Spring 2008 - Saddleback College

You also want an ePaper? Increase the reach of your titles
YUMPU automatically turns print PDFs into web optimized ePapers that Google loves.
Fall 2007 Biology 3A Abstracts<br />
carbohydrates improved growth and feed utilization<br />
of the fish (Tan et al, 2006).<br />
Although both proteins and carbohydrates<br />
contribute to the development of the organism, the<br />
influence of each nutrient is not essentially equal to<br />
the other (Lovell, 1991). Since each component has<br />
various effects on the development of the fish, its<br />
effect on growth was evaluated. In the current study,<br />
growth of fifteen juvenile goldfish was observed<br />
before and after exposure to three different diets: a<br />
high protein, a high carbohydrate and a combination<br />
diet comprising of both elements. Growth was<br />
measured as an increase in body size, change in body<br />
condition and overall weight gain. As mentioned<br />
earlier, each nutrient has variable influence on<br />
growth; therefore, there should be a difference in<br />
growth or in the net weight gain of the goldfish<br />
between the different diets.<br />
Materials and Methods<br />
Experimental Diets<br />
Fifteen juvenile goldfish obtained from PetSmart<br />
at Mission Viejo, California were used in the study<br />
and were maintained in aerated, filtered water in<br />
three separate glass aquarium tanks. The goldfish<br />
were divided evenly into the three separate tanks and<br />
each tank was designated a different diet. Group A<br />
were given Micro Pellets (Kyorin Food Industry,<br />
Japan) with high protein content, Group B were given<br />
Baby Brine Shrimp Cubes (San Francisco Bay<br />
Manufacturing; Newark, California) with high<br />
carbohydrate content, and Group C were given<br />
TopFin Flakes (Pacific Coast Distributing, Phoenix),<br />
the control treatment, which contains both<br />
carbohydrates and proteins.<br />
When coupled with organic wastes discharged by<br />
the fish, excess feed in the tanks decreases dissolved<br />
oxygen in the water, which also decreases appetite<br />
and growth rate; hence, tanks were cleaned everyday<br />
before administering new sets of food, to ensure<br />
suitable environment for survival (Cacho et al, 1991).<br />
Weight Measurements and<br />
Calculations<br />
Each fish was weighed before the trial. Fish was<br />
removed from the tank using a net and was placed<br />
into a bucket containing tank water to carry out the<br />
measurements. Each fish was placed in a tared glass<br />
container of tank water on an electronic balance<br />
(Biology Department, <strong>Saddleback</strong> <strong>College</strong>) for body<br />
weight measurements, before being returned to their<br />
original tanks.<br />
Environmental changes, such as changes in<br />
temperature or pH levels, can cause stress to the<br />
normal physiology of the fish (Smith, 1966). In order<br />
to minimize stress, the groups were allowed to<br />
acclimatize to their new environment for one week<br />
prior to exposure to the different diets. After<br />
acclimatization for one week, each group was<br />
introduced to its new diet and was fed 1 gram of the<br />
food every 12 hours. Each group was given the same<br />
type of food for one week and subsequent weight<br />
measurements were made every week using an<br />
electronic balance. The study was conducted at room<br />
temperature (25–30 ºC) for four weeks in Mission<br />
Viejo, California starting February 24, <strong>2008</strong> to March<br />
12, <strong>2008</strong> and changes in growth were evaluated.<br />
Percentage of weight gained was obtained by using<br />
the nutritional index (Eq.1) (Bandyopadhyay et al,<br />
2005):<br />
Equation 1.<br />
Net Weight Gain = Final weight – Initial weight<br />
Weight Gain (%) = Net Weight Gain<br />
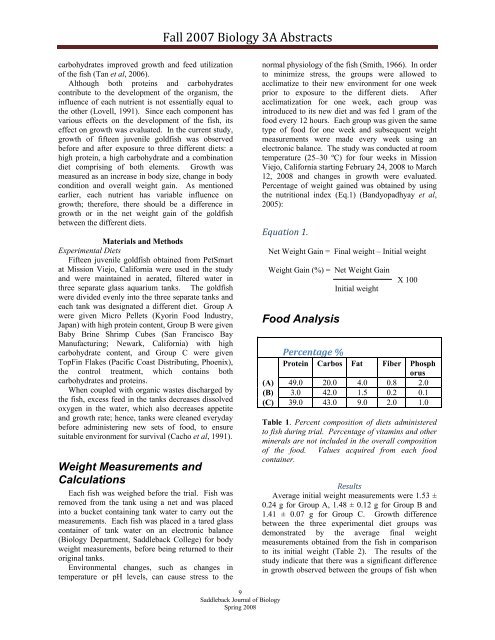
Food Analysis<br />
Initial weight<br />
X 100<br />
Percentage %<br />
Protein Carbos Fat Fiber Phosph<br />
orus<br />
(A) 49.0 20.0 4.0 0.8 2.0<br />
(B) 3.0 42.0 1.5 0.2 0.1<br />
(C) 39.0 43.0 9.0 2.0 1.0<br />
Table 1. Percent composition of diets administered<br />
to fish during trial. Percentage of vitamins and other<br />
minerals are not included in the overall composition<br />
of the food. Values acquired from each food<br />
container.<br />
Results<br />
Average initial weight measurements were 1.53 ±<br />
0.24 g for Group A, 1.48 ± 0.12 g for Group B and<br />
1.41 ± 0.07 g for Group C. Growth difference<br />
between the three experimental diet groups was<br />
demonstrated by the average final weight<br />
measurements obtained from the fish in comparison<br />
to its initial weight (Table 2). The results of the<br />
study indicate that there was a significant difference<br />
in growth observed between the groups of fish when<br />
9<br />
<strong>Saddleback</strong> Journal of Biology<br />
<strong>Spring</strong> <strong>2008</strong>