Volume 6, Spring 2008 - Saddleback College
Volume 6, Spring 2008 - Saddleback College
Volume 6, Spring 2008 - Saddleback College

Create successful ePaper yourself
Turn your PDF publications into a flip-book with our unique Google optimized e-Paper software.
Fall 2007 Biology 3A Abstracts<br />
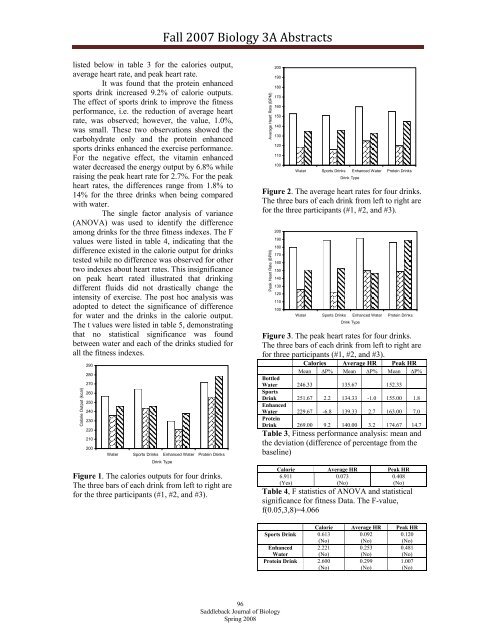
listed below in table 3 for the calories output,<br />
average heart rate, and peak heart rate.<br />
It was found that the protein enhanced<br />
sports drink increased 9.2% of calorie outputs.<br />
The effect of sports drink to improve the fitness<br />
performance, i.e. the reduction of average heart<br />
rate, was observed; however, the value, 1.0%,<br />
was small. These two observations showed the<br />
carbohydrate only and the protein enhanced<br />
sports drinks enhanced the exercise performance.<br />
For the negative effect, the vitamin enhanced<br />
water decreased the energy output by 6.8% while<br />
raising the peak heart rate for 2.7%. For the peak<br />
heart rates, the differences range from 1.8% to<br />
14% for the three drinks when being compared<br />
with water.<br />
The single factor analysis of variance<br />
(ANOVA) was used to identify the difference<br />
among drinks for the three fitness indexes. The F<br />
values were listed in table 4, indicating that the<br />
difference existed in the calorie output for drinks<br />
tested while no difference was observed for other<br />
two indexes about heart rates. This insignificance<br />
on peak heart rated illustrated that drinking<br />
different fluids did not drastically change the<br />
intensity of exercise. The post hoc analysis was<br />
adopted to detect the significance of difference<br />
for water and the drinks in the calorie output.<br />
The t values were listed in table 5, demonstrating<br />
that no statistical significance was found<br />
between water and each of the drinks studied for<br />
all the fitness indexes.<br />
Calorie Output (kcal)<br />
290<br />
280<br />
270<br />
260<br />
250<br />
240<br />
230<br />
220<br />
210<br />
200<br />
Water Sports Drinks Enhanced Water Protein Drinks<br />
Drink Type<br />
Figure 1. The calories outputs for four drinks.<br />
The three bars of each drink from left to right are<br />
for the three participants (#1, #2, and #3).<br />
Average Heart Rate (BPM)<br />
200<br />
190<br />
180<br />
170<br />
160<br />
150<br />
140<br />
130<br />
120<br />
110<br />
100<br />
Water Sports Drinks Enhanced Water Protein Drinks<br />
Drink Type<br />
Figure 2. The average heart rates for four drinks.<br />
The three bars of each drink from left to right are<br />
for the three participants (#1, #2, and #3).<br />
Peak Heart Rate (BPM)<br />
200<br />
190<br />
180<br />
170<br />
160<br />
150<br />
140<br />
130<br />
120<br />
110<br />
100<br />
Water Sports Drinks Enhanced Water Protein Drinks<br />
Drink Type<br />
Figure 3. The peak heart rates for four drinks.<br />
The three bars of each drink from left to right are<br />
for three participants (#1, #2, and #3).<br />
Calories Average HR Peak HR<br />
Mean ∆P% Mean ∆P% Mean ∆P%<br />
Bottled<br />
Water 246.33 135.67 152.33<br />
Sports<br />
Drink 251.67 2.2 134.33 -1.0 155.00 1.8<br />
Enhanced<br />
Water 229.67 -6.8 139.33 2.7 163.00 7.0<br />
Protein<br />
Drink 269.00 9.2 140.00 3.2 174.67 14.7<br />
Table 3, Fitness performance analysis: mean and<br />
the deviation (difference of percentage from the<br />
baseline)<br />
Calorie Average HR Peak HR<br />
6.911<br />
0.073<br />
0.408<br />
(Yes)<br />
(No)<br />
(No)<br />
Table 4, F statistics of ANOVA and statistical<br />
significance for fitness Data. The F-value,<br />
f(0.05,3,8)=4.066<br />
Calorie Average HR Peak HR<br />
Sports Drink 0.613<br />
(No)<br />
0.092<br />
(No)<br />
0.120<br />
(No)<br />
Enhanced<br />
Water<br />
2.221<br />
(No)<br />
0.253<br />
(No)<br />
0.481<br />
(No)<br />
Protein Drink 2.600<br />
(No)<br />
0.299<br />
(No)<br />
1.007<br />
(No)<br />
96<br />
<strong>Saddleback</strong> Journal of Biology<br />
<strong>Spring</strong> <strong>2008</strong>