Volume 6, Spring 2008 - Saddleback College
Volume 6, Spring 2008 - Saddleback College
Volume 6, Spring 2008 - Saddleback College

Create successful ePaper yourself
Turn your PDF publications into a flip-book with our unique Google optimized e-Paper software.
Fall 2007 Biology 3A Abstracts<br />
The sixteen Early Girl Tomato plants were<br />
purchased from Armstrong Gardens in San Juan<br />
Capistrano, California. The tomatoes were potted in<br />
plastic pots (11 cm in diameter) with four drainage<br />
holes at the bottom of each pot. The plants were placed<br />
together outside in direct sunlight and the temperature<br />
was dependent on the outside weather in the city of San<br />
Juan Capistrano, California. All sixteen tomato plants<br />
were centered between two sprinklers providing the<br />
equal amounts of water daily. Once a week, one group<br />
of eight tomato plants were given 9.92 ml of E.B.<br />
Stone Organic Fertilizer and the other eight tomato<br />
plants were given 9.92 ml of Miracle Gro Fertilizer<br />
(chemical). For one month each individual tomato<br />
plant was measured for height of stalk every two weeks<br />
(see Fig. 1). Also, counted were the numbers of<br />
blossoms per group at the end of week four for the Chi-<br />
Square analysis (see Fig. 2). There are group pictures<br />
displaying the progress of both groups of tomato<br />
plants.<br />
Chlorophyll concentration in tomato plant<br />
leaves between organic and chemical fertilizers were<br />
taken using the Beckmann Du 700 spectrophotometer.<br />
A total of three samples of chlorophyll extract were<br />
taken from each organic and chemical fertilizer groups.<br />
Each vial sample contained two 6.1 mm leaf discs<br />
(using a paper hole puncher) added to 5ml of 80 %<br />
(v/v) acetone. All forty-eight vials (24 of each group)<br />
placed into the refrigerator (4º C) for 24 hours.<br />
Concentration of chlorophyll was then measured using<br />
the Beckmann Du 700 spectrophotometer. An average<br />
of 3ml per sample in the vial were transferred into a<br />
cuvette for absorbance reading which is a measure of<br />
the light absorbed by the solution in nanometers (nm).<br />
The average total chlorophyll concentration of organic<br />
and chemical fertilizers was calculated in mg/L and a<br />
T· test was done (see Fig. 3).<br />
Results<br />
The tomato plants that were fed chemical<br />
fertilizer (Miracle Gro) grew to be taller in height (cm)<br />
than the tomato plants grown in organic fertilizer. Our<br />
experiment suggests that chemical fertilizer produces<br />
more fruit because the count of blossoms was 84 versus<br />
the organic tomato plants which produced 63 blossoms<br />
at the end of the four week period. Both groups of<br />
tomato plants initially started out at with an average<br />
height of 13cm. For the first measurement after two<br />
weeks, the average chemical fertilizer grew 10cm and<br />
the average organic fertilizer plants grew 9cm. The<br />
second measurement at the end of four weeks<br />
displayed a significant difference in that the chemically<br />
fed tomato plants with an additional average growth of<br />
19cm (total in 4 weeks = 29cm) while the organically<br />
65<br />
<strong>Saddleback</strong> Journal of Biology<br />
<strong>Spring</strong> <strong>2008</strong><br />
fed tomato plants with only an additional average<br />
growth of 14cm (total in 4 weeks = 23cm). We also<br />
measured the chlorophyll concentration of the different<br />
plants leaves. We found that there was a significant<br />
difference between plants grown chemically had more<br />
chlorophyll than organic fertilizer (P = 0.000518, one<br />
tail unpaired T · test).<br />
Chlorophyll concentration (mg/L)<br />
400<br />
350<br />
300<br />
250<br />
200<br />
150<br />
100<br />
50<br />
0<br />
Non-organic<br />
Organic<br />
Fertilizer Groups<br />
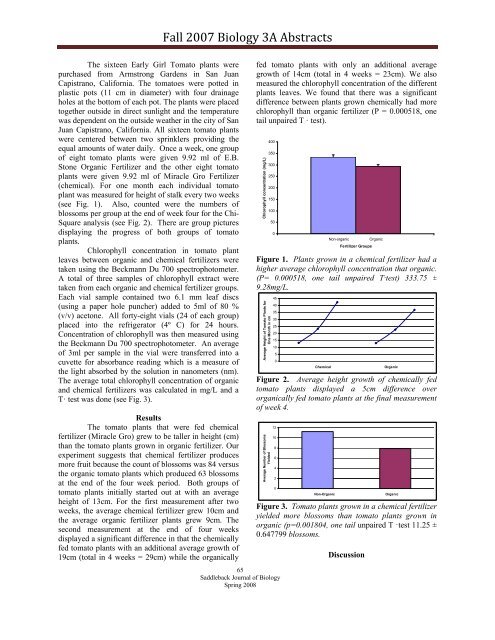
Figure 1. Plants grown in a chemical fertilizer had a<br />
higher average chlorophyll concentration that organic.<br />
(P= 0.000518, one tail unpaired T·test) 333.75 ±<br />
9.28mg/L.<br />
Average Height of Tomato Plants for<br />
One Month in cm<br />
45<br />
40<br />
35<br />
30<br />
25<br />
20<br />
15<br />
10<br />
5<br />
0<br />
Figure 2. Average height growth of chemically fed<br />
tomato plants displayed a 5cm difference over<br />
organically fed tomato plants at the final measurement<br />
of week 4.<br />
Average Number of Blossoms<br />
Yielded<br />
12<br />
10<br />
8<br />
6<br />
4<br />
2<br />
0<br />
Chemical<br />
Non-Organic<br />
Figure 3. Tomato plants grown in a chemical fertilizer<br />
yielded more blossoms than tomato plants grown in<br />
organic (p=0.001804, one tail unpaired T ·test 11.25 ±<br />
0.647799 blossoms.<br />
Discussion<br />
Organic<br />
Organic