COMPARISON OF BUDGETED PER PUPIL EXPENDITURES * The cost of educating children varies between school districts throughout the state of Texas. The following graph shows that from the urban school districts represented in this analysis, average per pupil expenditures were $6,972. The district with the highest per pupil expenditures was Austin ISD while the district with lowest was Corpus Christi ISD. Only expenditures for object code 6100 through 6400's for the General Fund are represented in the per pupil comparison. Rankings from Highest to Lowest Austin Dallas Ysleta Average All <strong>District</strong>s Northside Houston El Paso <strong>San</strong> <strong>Antonio</strong> Corpus Christi $7,689 $7,255 $7,082 $6,972 $6,871 $6,847 $6,563 $6,470 $6,413 Corpus Christi <strong>San</strong> <strong>Antonio</strong> El Paso Average Houston Northside All <strong>District</strong>s Ysleta Dallas Austin Inst & Inst-Related Svcs 4,248 4,385 4,572 4,841 4,834 4,787 4,694 4,830 5,234 Inst & Sch Leadership 611 496 582 657 623 634 631 656 693 Student Support Svcs 480 465 454 218 487 383 528 402 402 Support Svcs-Non Stdt Based 1,074 1,123 955 1,131 927 1,168 1,229 1,367 1,360 Per Pupil Expenditures of Total Direct Costs $6,413 $6,470 $6,563 $6,847 $6,871 $6,972 $7,082 $7,255 $7,689 Average Source: 2010-11 AEIS <strong>District</strong> Reports 99
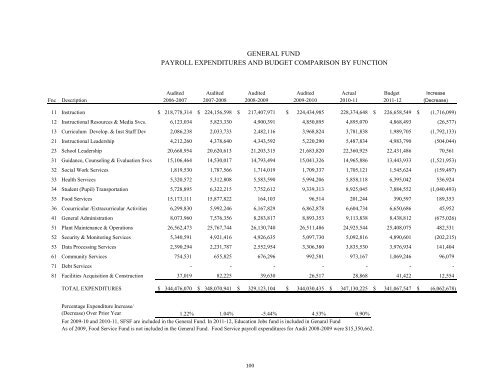
GENERAL FUND PAYROLL EXPENDITURES AND BUDGET COMPARISON BY FUNCTION Audited Audited Audited Audited Actual <strong>Budget</strong> Increase Fnc Description 2006-2007 2007-2008 2008-2009 2009-2010 2010-11 <strong>2011</strong>-12 (Decrease) 11 Instruction $ 218,778,314 $ 224,156,598 $ 217,407,971 $ 224,434,985 228,374,648 $ 226,658,549 $ (1,716,099) 12 Instructional Resources & Media Svcs. 6,123,034 5,823,330 4,900,391 4,850,895 4,895,070 4,868,493 (26,577) 13 Curriculum Develop. & Inst Staff Dev 2,086,238 2,033,733 2,482,116 3,968,824 3,781,838 1,989,705 (1,792,133) 21 Instructional Leadership 4,212,260 4,378,640 4,343,592 5,220,290 5,487,834 4,983,790 (504,044) 23 <strong>School</strong> Leadership 20,668,954 20,620,613 21,203,315 21,683,820 22,360,925 22,431,486 70,561 31 Guidance, Counseling & Evaluation Svcs 15,106,464 14,530,017 14,793,494 15,041,326 14,965,886 13,443,933 (1,521,953) 32 Social Work Services 1,819,530 1,787,566 1,714,019 1,709,337 1,705,121 1,545,624 (159,497) 33 Health Services 5,320,572 5,312,808 5,583,590 5,994,206 5,858,118 6,395,042 536,924 34 Student (Pupil) Transportation 5,728,895 6,322,215 7,752,612 9,339,313 8,925,045 7,884,552 (1,040,493) 35 Food Services 15,173,111 15,877,822 164,103 96,514 201,244 390,597 189,353 36 Cocurricular /Extracurricular Activities 6,299,830 5,992,246 6,167,829 6,862,878 6,604,734 6,650,686 45,952 41 General Administration 8,073,960 7,576,356 8,283,817 8,893,353 9,113,838 8,438,812 (675,026) 51 Plant Maintenance & Operations 26,562,473 25,767,744 26,130,740 26,511,486 24,925,544 25,408,075 482,531 52 Security & Monitoring Services 5,340,591 4,921,416 4,926,635 5,097,730 5,092,816 4,890,601 (202,215) 53 Data Processing Services 2,390,294 2,231,787 2,552,954 3,306,380 3,835,530 3,976,934 141,404 61 Community Services 754,531 655,825 676,296 992,581 973,167 1,069,246 96,079 71 Debt Services - - - - - - - 81 Facilities Acquisition & Construction 37,019 82,225 39,630 26,517 28,868 41,422 12,554 TOTAL EXPENDITURES $ 344,476,070 $ 348,070,941 $ 329,123,104 $ 344,030,435 $ 347,130,225 $ 341,067,547 $ (6,062,678) Percentage Expenditure Increase/ (Decrease) Over Prior Year 1.22% 1.04% -5.44% 4.53% 0.90% For 2009-10 and 2010-11, SFSF are included in the General Fund. In <strong>2011</strong>-12, Education Jobs fund is included in Genaral Fund As of 2009, Food Service Fund is not included in the General Fund. Food Service payroll expenditures for Audit 2008-2009 were $15,350,662. 100
- Page 1 and 2:
District Budget September 1, 2011 -
- Page 3 and 4:
Significant Financial Policies and
- Page 5 and 6:
Project Status and Financial Detail
- Page 7 and 8:
Curriculum Management .............
- Page 9:
WHAT ARE PROPERTY TAXES? Property t
- Page 12 and 13:
INTRODUCTION SECTION
- Page 14 and 15:
Our most important objective in the
- Page 16 and 17:
public school finance system. The c
- Page 18 and 19:
Analysis of Adopted Budget The comp
- Page 20 and 21:
Debt Service Fund The following tab
- Page 22 and 23:
San Antonio ISD's ADA Trend 52,000
- Page 24 and 25:
2011-12 District Budget Highlights
- Page 26:
ADDENDUM This budget report was pre
- Page 30 and 31:
Budget Highlights 2011-2012 • •
- Page 32 and 33:
SAISD District Recognitions and Acc
- Page 34 and 35:
District campuses recognized for co
- Page 36 and 37:
That individualized attention will
- Page 38 and 39:
MEET THE SEVEN TRUSTEES OF OUR DIST
- Page 40 and 41:
SCHOOL BOARD HIGHLIGHTS The Board o
- Page 42 and 43:
2011- 2012 MEETING SCHEDULE Work Se
- Page 44 and 45:
CONSULTANTS & ADVISORS LEGAL COUNSE
- Page 46 and 47:
OUR MISSION, BELIEFS AND CORE VALUE
- Page 48 and 49:
• People support what they help c
- Page 50 and 51:
CAMPUS AND OPERATIONS Presently the
- Page 52 and 53:
Rudy Martinez-Interim, Leadership E
- Page 54 and 55:
WHAT SAISD OFFERS STUDENTS • Trav
- Page 56 and 57:
FINANCIAL STRUCTURE AND BASIS OF AC
- Page 58 and 59:
DISTRICT REVENUE SOURCES The San An
- Page 60 and 61:
DEBT SERVICE FUND The Debt Service
- Page 62 and 63:
BASIS OF ACCOUNTING CODE STRUCTURE
- Page 64 and 65:
Function codes are grouped accordin
- Page 66 and 67: Major Object Code Major Expenditure
- Page 68 and 69: SIGNIFICANT FINANCIAL POLICIES AND
- Page 70 and 71: CAPITAL IMPROVEMENTS The District d
- Page 72 and 73: BUDGET POLICIES AND DEVELOPMENT PRO
- Page 74 and 75: BUDGET MEETING The annual public me
- Page 76 and 77: • Level I makes use of modified z
- Page 78 and 79: BUDGET ADMINISTRATION AND MANAGEMEN
- Page 80 and 81: BUDGET CALENDAR FOR FISCAL YEAR 201
- Page 83 and 84: GOVERNMENTAL FUNDS* SUMMARY OF REVE
- Page 85 and 86: GOVERNMENTAL FUNDS* SUMMARY OF REVE
- Page 87 and 88: San Antonio Independent School Dist
- Page 89 and 90: GOVERNMENTAL FUNDS REVENUES BY FUND
- Page 91 and 92: Governmental Funds Expenditures per
- Page 94 and 95: Vision 2012 Budget Enhancements 201
- Page 96 and 97: Vision 2012 Budget Enhancements 201
- Page 98 and 99: SUMMARY OF ESTIMATED REVENUES, EXPE
- Page 100 and 101: SUMMARY OF ESTIMATED REVENUES, EXPE
- Page 102 and 103: 2011-2012 Budget by Major Object Co
- Page 104 and 105: Appropriations Budget 2011-2012 TEA
- Page 106 and 107: Summary of Estimated Revenues by Fu
- Page 108 and 109: Estimated Expenditures by Function
- Page 111 and 112: GENERAL FUND This fund group accoun
- Page 113 and 114: GENERAL FUND REVENUE TRENDS Last Te
- Page 115: San Antonio Independent School Dist
- Page 119 and 120: GENERAL FUND REVENUES AND EXPENDITU
- Page 121 and 122: General Fund Estimated Expenditures
- Page 123 and 124: General Fund Function Comparison FI
- Page 125 and 126: General Fund by Program Intent and
- Page 127: CHANGES IN FUND BALANCE - GENERAL F
- Page 130 and 131: FOOD & CHILD NUTRITION SERVICES OVE
- Page 132 and 133: FOODS OF MINIMAL NUTRITIONAL VALUE
- Page 134 and 135: SCHOOL BREAKFAST PROGRAM The Food a
- Page 136 and 137: PROGRAM PARTICIPATION One of the an
- Page 139 and 140: SPECIAL REVENUE FUND This fund grou
- Page 141 and 142: Special Revenue Fund Estimated Reve
- Page 143: Special Revenue by Function and Maj
- Page 146 and 147: DEBT SERVICE FUND REVENUES AND EXPE
- Page 148 and 149: Debt Service Fund Charts Estimated
- Page 150 and 151: COMPUTATION OF DIRECT AND ESTIMATED
- Page 152: RATIO OF NET GENERAL OBLIGATION BON
- Page 155 and 156: CAPITAL PROJECTS FUND REVENUES AND
- Page 157 and 158: 1997 BOND PROGRAM UPDATE Through th
- Page 159 and 160: SAISD ENERGY EFFICIENCY INITIATIVES
- Page 161 and 162: SAISD Bond 2010 Program Administrat
- Page 163 and 164: SAISD Bond 2010 Program Administrat
- Page 165 and 166: SAISD Bond 2010 Program Administrat
- Page 167 and 168:
SAISD Bond 2010 Program Administrat
- Page 169 and 170:
Program Administrator: Munoz Jacobs
- Page 171 and 172:
Program Administrator: Munoz Jacobs
- Page 173 and 174:
Program Administrator: Munoz Jacobs
- Page 175 and 176:
Program Administrator: SAISD Projec
- Page 177 and 178:
SAISD Bond 2010 Program Administrat
- Page 179 and 180:
Program Administrator: Munoz Jacobs
- Page 181 and 182:
Program Administrator: SAISD Projec
- Page 183 and 184:
Program Administrator: SAISD Projec
- Page 185 and 186:
Program Administrator: Munoz Jacobs
- Page 187 and 188:
Program Administrator: SAISD Projec
- Page 189 and 190:
Program Administrator: SAISD Projec
- Page 191 and 192:
Program Administrator: SAISD Projec
- Page 193 and 194:
Program Administrator: SAISD Projec
- Page 195 and 196:
Program Administrator: SAISD Projec
- Page 197 and 198:
Program Administrator: SAISD Projec
- Page 199 and 200:
SAISD Bond 2010 Program Administrat
- Page 201 and 202:
Program Administrator: SAISD Projec
- Page 203 and 204:
Program Administrator: SAISD Projec
- Page 205 and 206:
Program Administrator: Munoz Jacobs
- Page 207 and 208:
Program Administrator: SAISD Projec
- Page 209 and 210:
Program Administrator: Munoz Jacobs
- Page 211 and 212:
Program Administrator: SAISD Projec
- Page 213 and 214:
Program Administrator: SAISD Projec
- Page 215 and 216:
Program Administrator: SAISD Projec
- Page 217 and 218:
Program Administrator: Munoz Jacobs
- Page 219 and 220:
Program Administrator: Munoz Jacobs
- Page 221 and 222:
Program Administrator: SAISD Projec
- Page 223 and 224:
SAISD Bond 2010 Program Administrat
- Page 225 and 226:
Program Administrator: SAISD Projec
- Page 227 and 228:
Program Administrator: Munoz Jacobs
- Page 229 and 230:
Program Administrator: Munoz Jacobs
- Page 231 and 232:
Program Administrator: SAISD Projec
- Page 233 and 234:
SAISD Bond 2010 Program Administrat
- Page 235 and 236:
Program Administrator: Munoz Jacobs
- Page 237 and 238:
Program Administrator: Munoz Jacobs
- Page 239 and 240:
Program Administrator: SAISD Projec
- Page 241 and 242:
Program Administrator: SAISD Projec
- Page 243 and 244:
Program Administrator: SAISD Projec
- Page 245:
INFORMATIONAL SECTION
- Page 248 and 249:
COMPTROLLER'S CERTIFIED PROPERTY VA
- Page 250 and 251:
SAISD PROPERTY TAX RATE HISTORY * T
- Page 252 and 253:
PROPERTY TAXES FOR AN AVERAGE RESID
- Page 254 and 255:
PROPERTY TAX RATES DIRECT AND OVERL
- Page 256 and 257:
ALLOCATION OF PROPERTY TAX RATES AN
- Page 258:
PRINCIPAL TAXPAYERS * BUDGET YEAR 2
- Page 261 and 262:
San Antonio ISD Forecast of Budget
- Page 263 and 264:
FOOD SERVICE FUND FORECASTS REVENUE
- Page 265 and 266:
DEBT SERVICE FUND GENERAL OBLIGATIO
- Page 268 and 269:
STUDENT ENROLLMENT Over the years,
- Page 270 and 271:
Schools contributing to % of Grade
- Page 272 and 273:
SAISD EXTENDED PROJECTIONS Applying
- Page 274 and 275:
3 Years of Standardized Test Scores
- Page 276 and 277:
3 Years of Graduation and Dropout D
- Page 278 and 279:
3 Years of Goals and Objectives for
- Page 280 and 281:
Gold Performance Acknowledgements (
- Page 282 and 283:
Attendance Rate and Membership Dist
- Page 284 and 285:
2010 and 2011 TAKS Commended 29% 30
- Page 286 and 287:
Exit Level TAKS Cumulative Pass Rat
- Page 288 and 289:
English Language Learners The Engli
- Page 290 and 291:
Completion Rate I 2007 2008 2514 20
- Page 292 and 293:
SAISD Student College Entrance Exam
- Page 294 and 295:
DATA QUALITY • SAISD has consiste
- Page 297 and 298:
STAFF FULL TIME EQUIVALENTS (FTE) B
- Page 300 and 301:
MAJOR URBAN DISTRICTS COMPARISON BY
- Page 302 and 303:
URBAN DISTRICTS THREE-YEAR COMPARIS
- Page 304:
MAJOR URBAN DISTRICTS COMPARISON OF
- Page 307 and 308:
GENERAL FUND BY MAJOR OBJECT CODE &
- Page 309 and 310:
San Antonio Independent School Dist
- Page 311 and 312:
San Antonio Independent School Dist
- Page 313 and 314:
San Antonio Independent School Dist
- Page 315 and 316:
San Antonio Independent School Dist
- Page 317 and 318:
San Antonio Independent School Dist
- Page 319 and 320:
San Antonio Independent School Dist
- Page 321 and 322:
San Antonio Independent School Dist
- Page 323 and 324:
San Antonio Independent School Dist
- Page 325 and 326:
San Antonio Independent School Dist
- Page 327 and 328:
San Antonio Independent School Dist
- Page 329 and 330:
ENROLLMENT AND BUDGET MULTI-YEAR CO
- Page 331 and 332:
COMPARISON OF EXPENDITURES AND BUDG
- Page 333:
COMPARISON OF EXPENDITURES AND BUDG
- Page 336 and 337:
SPECIAL REVENUE FUND BUDGETS BY MAJ
- Page 338 and 339:
COMPARISON OF EXPENDITURES AND BUDG
- Page 340:
COMPARISON OF EXPENDITURES AND BUDG
- Page 344 and 345:
Superintendent's Office - Org. # 70
- Page 346 and 347:
Governmental & Community Relations
- Page 348 and 349:
Community & Parent Partners - Org.
- Page 350 and 351:
Safety & Security (Police) - Org. #
- Page 352:
Printing Services - Org. # 960 Budg
- Page 355:
Employee Benefits, Risk Management
- Page 358 and 359:
Teaching & Learning - Org. # 805 Bu
- Page 360 and 361:
School Leadership E.S. Team 2 - Org
- Page 362 and 363:
School Leadership E.S. Team 1 - Org
- Page 364 and 365:
Transitions Program - Org. # 851 Bu
- Page 366 and 367:
Professional Learning - Org. # 856
- Page 368 and 369:
Fine Arts - Org. # 858 Budget Year
- Page 370 and 371:
Grants Development, Management & Mo
- Page 372 and 373:
Academic Support - Org. # 865 Budge
- Page 374 and 375:
Early Childhood - Org. # 868 Budget
- Page 376 and 377:
Social Studies - Org. # 874 Budget
- Page 378 and 379:
Curriculum Management - Org. # 876
- Page 380 and 381:
Advanced Academics/ Gifted & Talent
- Page 382 and 383:
Science - Org. # 881 Budget Year 20
- Page 384 and 385:
Health/PE, Safe & Drug Free Schools
- Page 386 and 387:
Teen Parenting Services - Org. # 88
- Page 388 and 389:
Student Health Services - Org. # 89
- Page 390:
Federal Programs - Org. # 946 Budge
- Page 393 and 394:
Planning & Budget - Org. # 741 Budg
- Page 395 and 396:
Materials Management/Purchasing, Wa
- Page 397 and 398:
Food & Child Nutrition Services - O
- Page 400:
Technology & Management Information
- Page 403 and 404:
PS Custodial Services - Org. # 932
- Page 405 and 406:
PS MEP Maintenance - Org. # 934 Bud
- Page 408 and 409:
COMMUNITY PROFILE * San Antonio is
- Page 410 and 411:
HISTORICAL ATTRACTIONS COMMUNITY PR
- Page 412 and 413:
COMMUNITY PROFILE * COMMUNITY PROFI
- Page 414 and 415:
The ten largest corporate headquart
- Page 416 and 417:
SAN ANTONIO, TEXAS MSA DEMOGRAPHICS
- Page 418 and 419:
BASSE RD E HOUSTON ST UTOPIA AVE Lo
- Page 420 and 421:
SAN ANTONIO INDEPENDENT SCHOOL DIST
- Page 422 and 423:
08-09 # 09-10 # Indicator Descripti
- Page 424:
Received Board approval for purchas
- Page 427 and 428:
ACRONYMS ELA ELL ELPS EOC ES ESL -F
- Page 429 and 430:
ACRONYMS TEA TEAMS TEEM TEKS TPRI T
- Page 431 and 432:
GLOSSARY OF FUNDS Carl D. Perkins,
- Page 433 and 434:
GLOSSARY OF FUNDS IDEA -B - Prescho
- Page 435 and 436:
GLOSSARY OF FUNDS Technology Fund T
- Page 437 and 438:
GLOSSARY OF FUNDS Title I, Part D -
- Page 439 and 440:
GLOSSARY OF TERMS AVERAGE DAILY MEM
- Page 441 and 442:
GLOSSARY OF TERMS COST PER PUPIL -
- Page 443 and 444:
GLOSSARY OF TERMS GENERALLY ACCEPTE
- Page 445 and 446:
GLOSSARY OF TERMS SCHOOL - A divisi
- Page 447:
Thank you for your interest in the


