- Page 1 and 2:
District Budget September 1, 2011 -
- Page 3 and 4:
Significant Financial Policies and
- Page 5 and 6:
Project Status and Financial Detail
- Page 7 and 8:
Curriculum Management .............
- Page 9:
WHAT ARE PROPERTY TAXES? Property t
- Page 12 and 13:
INTRODUCTION SECTION
- Page 14 and 15:
Our most important objective in the
- Page 16 and 17:
public school finance system. The c
- Page 18 and 19:
Analysis of Adopted Budget The comp
- Page 20 and 21:
Debt Service Fund The following tab
- Page 22 and 23:
San Antonio ISD's ADA Trend 52,000
- Page 24 and 25:
2011-12 District Budget Highlights
- Page 26:
ADDENDUM This budget report was pre
- Page 30 and 31:
Budget Highlights 2011-2012 • •
- Page 32 and 33:
SAISD District Recognitions and Acc
- Page 34 and 35:
District campuses recognized for co
- Page 36 and 37:
That individualized attention will
- Page 38 and 39:
MEET THE SEVEN TRUSTEES OF OUR DIST
- Page 40 and 41:
SCHOOL BOARD HIGHLIGHTS The Board o
- Page 42 and 43:
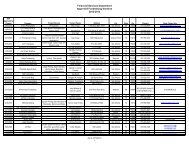
2011- 2012 MEETING SCHEDULE Work Se
- Page 44 and 45:
CONSULTANTS & ADVISORS LEGAL COUNSE
- Page 46 and 47:
OUR MISSION, BELIEFS AND CORE VALUE
- Page 48 and 49:
• People support what they help c
- Page 50 and 51:
CAMPUS AND OPERATIONS Presently the
- Page 52 and 53:
Rudy Martinez-Interim, Leadership E
- Page 54 and 55:
WHAT SAISD OFFERS STUDENTS • Trav
- Page 56 and 57:
FINANCIAL STRUCTURE AND BASIS OF AC
- Page 58 and 59:
DISTRICT REVENUE SOURCES The San An
- Page 60 and 61:
DEBT SERVICE FUND The Debt Service
- Page 62 and 63:
BASIS OF ACCOUNTING CODE STRUCTURE
- Page 64 and 65:
Function codes are grouped accordin
- Page 66 and 67:
Major Object Code Major Expenditure
- Page 68 and 69:
SIGNIFICANT FINANCIAL POLICIES AND
- Page 70 and 71:
CAPITAL IMPROVEMENTS The District d
- Page 72 and 73:
BUDGET POLICIES AND DEVELOPMENT PRO
- Page 74 and 75:
BUDGET MEETING The annual public me
- Page 76 and 77:
• Level I makes use of modified z
- Page 78 and 79:
BUDGET ADMINISTRATION AND MANAGEMEN
- Page 80 and 81:
BUDGET CALENDAR FOR FISCAL YEAR 201
- Page 83 and 84: GOVERNMENTAL FUNDS* SUMMARY OF REVE
- Page 85 and 86: GOVERNMENTAL FUNDS* SUMMARY OF REVE
- Page 87 and 88: San Antonio Independent School Dist
- Page 89 and 90: GOVERNMENTAL FUNDS REVENUES BY FUND
- Page 91 and 92: Governmental Funds Expenditures per
- Page 94 and 95: Vision 2012 Budget Enhancements 201
- Page 96 and 97: Vision 2012 Budget Enhancements 201
- Page 98 and 99: SUMMARY OF ESTIMATED REVENUES, EXPE
- Page 100 and 101: SUMMARY OF ESTIMATED REVENUES, EXPE
- Page 102 and 103: 2011-2012 Budget by Major Object Co
- Page 104 and 105: Appropriations Budget 2011-2012 TEA
- Page 106 and 107: Summary of Estimated Revenues by Fu
- Page 108 and 109: Estimated Expenditures by Function
- Page 111 and 112: GENERAL FUND This fund group accoun
- Page 113 and 114: GENERAL FUND REVENUE TRENDS Last Te
- Page 115 and 116: San Antonio Independent School Dist
- Page 117 and 118: GENERAL FUND PAYROLL EXPENDITURES A
- Page 119 and 120: GENERAL FUND REVENUES AND EXPENDITU
- Page 121 and 122: General Fund Estimated Expenditures
- Page 123 and 124: General Fund Function Comparison FI
- Page 125 and 126: General Fund by Program Intent and
- Page 127: CHANGES IN FUND BALANCE - GENERAL F
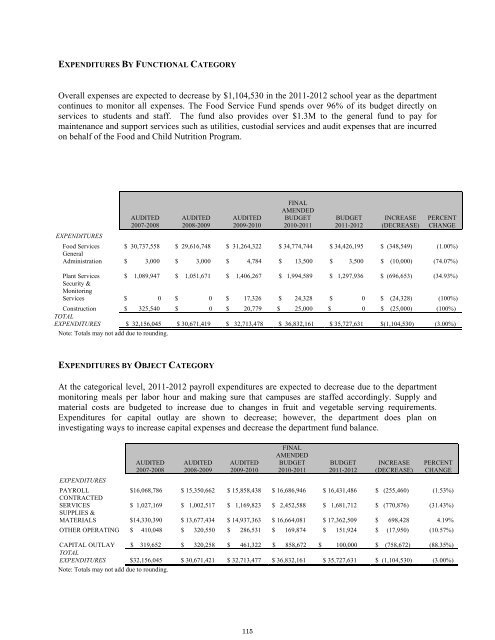
- Page 130 and 131: FOOD & CHILD NUTRITION SERVICES OVE
- Page 134 and 135: SCHOOL BREAKFAST PROGRAM The Food a
- Page 136 and 137: PROGRAM PARTICIPATION One of the an
- Page 139 and 140: SPECIAL REVENUE FUND This fund grou
- Page 141 and 142: Special Revenue Fund Estimated Reve
- Page 143: Special Revenue by Function and Maj
- Page 146 and 147: DEBT SERVICE FUND REVENUES AND EXPE
- Page 148 and 149: Debt Service Fund Charts Estimated
- Page 150 and 151: COMPUTATION OF DIRECT AND ESTIMATED
- Page 152: RATIO OF NET GENERAL OBLIGATION BON
- Page 155 and 156: CAPITAL PROJECTS FUND REVENUES AND
- Page 157 and 158: 1997 BOND PROGRAM UPDATE Through th
- Page 159 and 160: SAISD ENERGY EFFICIENCY INITIATIVES
- Page 161 and 162: SAISD Bond 2010 Program Administrat
- Page 163 and 164: SAISD Bond 2010 Program Administrat
- Page 165 and 166: SAISD Bond 2010 Program Administrat
- Page 167 and 168: SAISD Bond 2010 Program Administrat
- Page 169 and 170: Program Administrator: Munoz Jacobs
- Page 171 and 172: Program Administrator: Munoz Jacobs
- Page 173 and 174: Program Administrator: Munoz Jacobs
- Page 175 and 176: Program Administrator: SAISD Projec
- Page 177 and 178: SAISD Bond 2010 Program Administrat
- Page 179 and 180: Program Administrator: Munoz Jacobs
- Page 181 and 182: Program Administrator: SAISD Projec
- Page 183 and 184:
Program Administrator: SAISD Projec
- Page 185 and 186:
Program Administrator: Munoz Jacobs
- Page 187 and 188:
Program Administrator: SAISD Projec
- Page 189 and 190:
Program Administrator: SAISD Projec
- Page 191 and 192:
Program Administrator: SAISD Projec
- Page 193 and 194:
Program Administrator: SAISD Projec
- Page 195 and 196:
Program Administrator: SAISD Projec
- Page 197 and 198:
Program Administrator: SAISD Projec
- Page 199 and 200:
SAISD Bond 2010 Program Administrat
- Page 201 and 202:
Program Administrator: SAISD Projec
- Page 203 and 204:
Program Administrator: SAISD Projec
- Page 205 and 206:
Program Administrator: Munoz Jacobs
- Page 207 and 208:
Program Administrator: SAISD Projec
- Page 209 and 210:
Program Administrator: Munoz Jacobs
- Page 211 and 212:
Program Administrator: SAISD Projec
- Page 213 and 214:
Program Administrator: SAISD Projec
- Page 215 and 216:
Program Administrator: SAISD Projec
- Page 217 and 218:
Program Administrator: Munoz Jacobs
- Page 219 and 220:
Program Administrator: Munoz Jacobs
- Page 221 and 222:
Program Administrator: SAISD Projec
- Page 223 and 224:
SAISD Bond 2010 Program Administrat
- Page 225 and 226:
Program Administrator: SAISD Projec
- Page 227 and 228:
Program Administrator: Munoz Jacobs
- Page 229 and 230:
Program Administrator: Munoz Jacobs
- Page 231 and 232:
Program Administrator: SAISD Projec
- Page 233 and 234:
SAISD Bond 2010 Program Administrat
- Page 235 and 236:
Program Administrator: Munoz Jacobs
- Page 237 and 238:
Program Administrator: Munoz Jacobs
- Page 239 and 240:
Program Administrator: SAISD Projec
- Page 241 and 242:
Program Administrator: SAISD Projec
- Page 243 and 244:
Program Administrator: SAISD Projec
- Page 245:
INFORMATIONAL SECTION
- Page 248 and 249:
COMPTROLLER'S CERTIFIED PROPERTY VA
- Page 250 and 251:
SAISD PROPERTY TAX RATE HISTORY * T
- Page 252 and 253:
PROPERTY TAXES FOR AN AVERAGE RESID
- Page 254 and 255:
PROPERTY TAX RATES DIRECT AND OVERL
- Page 256 and 257:
ALLOCATION OF PROPERTY TAX RATES AN
- Page 258:
PRINCIPAL TAXPAYERS * BUDGET YEAR 2
- Page 261 and 262:
San Antonio ISD Forecast of Budget
- Page 263 and 264:
FOOD SERVICE FUND FORECASTS REVENUE
- Page 265 and 266:
DEBT SERVICE FUND GENERAL OBLIGATIO
- Page 268 and 269:
STUDENT ENROLLMENT Over the years,
- Page 270 and 271:
Schools contributing to % of Grade
- Page 272 and 273:
SAISD EXTENDED PROJECTIONS Applying
- Page 274 and 275:
3 Years of Standardized Test Scores
- Page 276 and 277:
3 Years of Graduation and Dropout D
- Page 278 and 279:
3 Years of Goals and Objectives for
- Page 280 and 281:
Gold Performance Acknowledgements (
- Page 282 and 283:
Attendance Rate and Membership Dist
- Page 284 and 285:
2010 and 2011 TAKS Commended 29% 30
- Page 286 and 287:
Exit Level TAKS Cumulative Pass Rat
- Page 288 and 289:
English Language Learners The Engli
- Page 290 and 291:
Completion Rate I 2007 2008 2514 20
- Page 292 and 293:
SAISD Student College Entrance Exam
- Page 294 and 295:
DATA QUALITY • SAISD has consiste
- Page 297 and 298:
STAFF FULL TIME EQUIVALENTS (FTE) B
- Page 300 and 301:
MAJOR URBAN DISTRICTS COMPARISON BY
- Page 302 and 303:
URBAN DISTRICTS THREE-YEAR COMPARIS
- Page 304:
MAJOR URBAN DISTRICTS COMPARISON OF
- Page 307 and 308:
GENERAL FUND BY MAJOR OBJECT CODE &
- Page 309 and 310:
San Antonio Independent School Dist
- Page 311 and 312:
San Antonio Independent School Dist
- Page 313 and 314:
San Antonio Independent School Dist
- Page 315 and 316:
San Antonio Independent School Dist
- Page 317 and 318:
San Antonio Independent School Dist
- Page 319 and 320:
San Antonio Independent School Dist
- Page 321 and 322:
San Antonio Independent School Dist
- Page 323 and 324:
San Antonio Independent School Dist
- Page 325 and 326:
San Antonio Independent School Dist
- Page 327 and 328:
San Antonio Independent School Dist
- Page 329 and 330:
ENROLLMENT AND BUDGET MULTI-YEAR CO
- Page 331 and 332:
COMPARISON OF EXPENDITURES AND BUDG
- Page 333:
COMPARISON OF EXPENDITURES AND BUDG
- Page 336 and 337:
SPECIAL REVENUE FUND BUDGETS BY MAJ
- Page 338 and 339:
COMPARISON OF EXPENDITURES AND BUDG
- Page 340:
COMPARISON OF EXPENDITURES AND BUDG
- Page 344 and 345:
Superintendent's Office - Org. # 70
- Page 346 and 347:
Governmental & Community Relations
- Page 348 and 349:
Community & Parent Partners - Org.
- Page 350 and 351:
Safety & Security (Police) - Org. #
- Page 352:
Printing Services - Org. # 960 Budg
- Page 355:
Employee Benefits, Risk Management
- Page 358 and 359:
Teaching & Learning - Org. # 805 Bu
- Page 360 and 361:
School Leadership E.S. Team 2 - Org
- Page 362 and 363:
School Leadership E.S. Team 1 - Org
- Page 364 and 365:
Transitions Program - Org. # 851 Bu
- Page 366 and 367:
Professional Learning - Org. # 856
- Page 368 and 369:
Fine Arts - Org. # 858 Budget Year
- Page 370 and 371:
Grants Development, Management & Mo
- Page 372 and 373:
Academic Support - Org. # 865 Budge
- Page 374 and 375:
Early Childhood - Org. # 868 Budget
- Page 376 and 377:
Social Studies - Org. # 874 Budget
- Page 378 and 379:
Curriculum Management - Org. # 876
- Page 380 and 381:
Advanced Academics/ Gifted & Talent
- Page 382 and 383:
Science - Org. # 881 Budget Year 20
- Page 384 and 385:
Health/PE, Safe & Drug Free Schools
- Page 386 and 387:
Teen Parenting Services - Org. # 88
- Page 388 and 389:
Student Health Services - Org. # 89
- Page 390:
Federal Programs - Org. # 946 Budge
- Page 393 and 394:
Planning & Budget - Org. # 741 Budg
- Page 395 and 396:
Materials Management/Purchasing, Wa
- Page 397 and 398:
Food & Child Nutrition Services - O
- Page 400:
Technology & Management Information
- Page 403 and 404:
PS Custodial Services - Org. # 932
- Page 405 and 406:
PS MEP Maintenance - Org. # 934 Bud
- Page 408 and 409:
COMMUNITY PROFILE * San Antonio is
- Page 410 and 411:
HISTORICAL ATTRACTIONS COMMUNITY PR
- Page 412 and 413:
COMMUNITY PROFILE * COMMUNITY PROFI
- Page 414 and 415:
The ten largest corporate headquart
- Page 416 and 417:
SAN ANTONIO, TEXAS MSA DEMOGRAPHICS
- Page 418 and 419:
BASSE RD E HOUSTON ST UTOPIA AVE Lo
- Page 420 and 421:
SAN ANTONIO INDEPENDENT SCHOOL DIST
- Page 422 and 423:
08-09 # 09-10 # Indicator Descripti
- Page 424:
Received Board approval for purchas
- Page 427 and 428:
ACRONYMS ELA ELL ELPS EOC ES ESL -F
- Page 429 and 430:
ACRONYMS TEA TEAMS TEEM TEKS TPRI T
- Page 431 and 432:
GLOSSARY OF FUNDS Carl D. Perkins,
- Page 433 and 434:
GLOSSARY OF FUNDS IDEA -B - Prescho
- Page 435 and 436:
GLOSSARY OF FUNDS Technology Fund T
- Page 437 and 438:
GLOSSARY OF FUNDS Title I, Part D -
- Page 439 and 440:
GLOSSARY OF TERMS AVERAGE DAILY MEM
- Page 441 and 442:
GLOSSARY OF TERMS COST PER PUPIL -
- Page 443 and 444:
GLOSSARY OF TERMS GENERALLY ACCEPTE
- Page 445 and 446:
GLOSSARY OF TERMS SCHOOL - A divisi
- Page 447:
Thank you for your interest in the