
You also want an ePaper? Increase the reach of your titles
YUMPU automatically turns print PDFs into web optimized ePapers that Google loves.
TMT<br />
<strong>Memory</strong> Devices Technology<br />
8 October 2010<br />
abc<br />
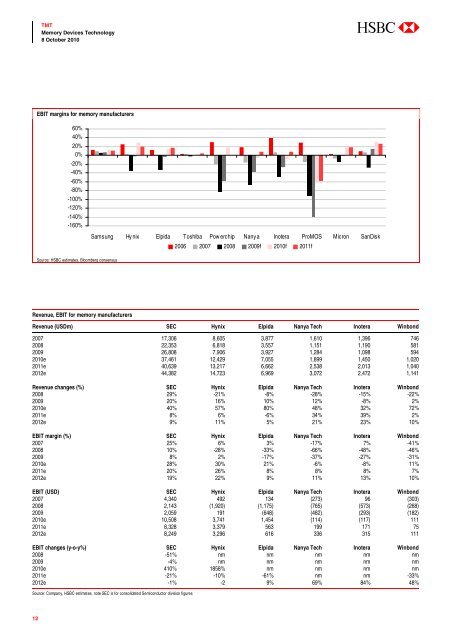
EBIT margins for memory manufacturers<br />
60%<br />
40%<br />
20%<br />
0%<br />
-20%<br />
-40%<br />
-60%<br />
-80%<br />
-100%<br />
-120%<br />
-140%<br />
-160%<br />
Samsung Hy nix Elpida Toshiba Pow erchip Nany a Inotera ProMOS Micron SanDisk<br />
2006 2007 2008 2009f 2010f 2011f<br />
Source: HSBC estimates, Bloomberg consensus<br />
Revenue, EBIT for memory manufacturers<br />
Revenue (USDm) SEC Hynix Elpida Nanya Tech Inotera Winbond<br />
2007 17,306 8,605 3,877 1,610 1,396 746<br />
2008 22,353 6,818 3,557 1,151 1,190 581<br />
2009 26,808 7,906 3,927 1,284 1,098 594<br />
2010e 37,461 12,429 7,055 1,899 1,450 1,020<br />
2011e 40,639 13,217 6,662 2,538 2,013 1,040<br />
2012e 44,382 14,723 6,969 3,072 2,472 1,141<br />
Revenue changes (%) SEC Hynix Elpida Nanya Tech Inotera Winbond<br />
2008 29% -21% -8% -28% -15% -22%<br />
2009 20% 16% 10% 12% -8% 2%<br />
2010e 40% 57% 80% 48% 32% 72%<br />
2011e 8% 6% -6% 34% 39% 2%<br />
2012e 9% 11% 5% 21% 23% 10%<br />
EBIT margin (%) SEC Hynix Elpida Nanya Tech Inotera Winbond<br />
2007 25% 6% 3% -17% 7% -41%<br />
2008 10% -28% -33% -66% -48% -46%<br />
2009 8% 2% -17% -37% -27% -31%<br />
2010e 28% 30% 21% -6% -8% 11%<br />
2011e 20% 26% 8% 8% 8% 7%<br />
2012e 19% 22% 9% 11% 13% 10%<br />
EBIT (USD) SEC Hynix Elpida Nanya Tech Inotera Winbond<br />
2007 4,340 492 134 (273) 96 (303)<br />
2008 2,143 (1,920) (1,175) (765) (573) (268)<br />
2009 2,059 191 (648) (482) (293) (182)<br />
2010e 10,508 3,741 1,454 (114) (117) 111<br />
2011e 8,328 3,379 563 199 171 75<br />
2012e 8,249 3,296 616 336 315 111<br />
EBIT changes (y-o-y%) SEC Hynix Elpida Nanya Tech Inotera Winbond<br />
2008 -51% nm nm nm nm nm<br />
2009 -4% nm nm nm nm nm<br />
2010e 410% 1858% nm nm nm nm<br />
2011e -21% -10% -61% nm nm -33%<br />
2012e -1% -2 9% 69% 84% 48%<br />
Source: Company, HSBC estimates, note SEC is for consolidated Semiconductor division figures<br />
12