
You also want an ePaper? Increase the reach of your titles
YUMPU automatically turns print PDFs into web optimized ePapers that Google loves.
TMT<br />
<strong>Memory</strong> Devices Technology<br />
8 October 2010<br />
abc<br />
Technology migration<br />
Winbond has successfully migrated its NOR<br />
production from 130nm to 90nm. In 3Q10, all 10k<br />
NOR capacity are in 90nm. For DRAM,<br />
Winbond’s target is to migrate its 16k capacity to<br />
65nm.<br />
Ongoing migrations: Winbond has scheduled to<br />
further migrate 1) NOR capacity to 58nm by<br />
2H11 and 2) DRAM capacity to 46nm also by<br />
2H11.<br />
ASP and bit growth assumptions<br />
80.0%<br />
60.0%<br />
40.0%<br />
20.0%<br />
0.0%<br />
-20.0%<br />
-40.0%<br />
2008 2009 2010f 2011f 2012f<br />
Bit growth ASP<br />
Source: Company data, HSBC estimates<br />
Forecast revision<br />
3Q10 revenue and margins should still be holding<br />
up well, thanks to the long-term contractual<br />
relationships which Winbond has built up with<br />
customers, together with strong demand from<br />
specialty DRAM and mobile demand, even<br />
though NOR supply/demand has come to a<br />
relatively more balanced situation. Winbond will<br />
likely post a gain of TWD0.8bn from the sale of<br />
its Nuvoton stake on the latter’s listing in late<br />
September. Following the sale, Winbond still<br />
holds 62.5% of Nuvoton.<br />
Revenue growth<br />
40,000<br />
30,000<br />
20,000<br />
10,000<br />
-<br />
2007 2008 2009 2010f 2011f 2012f<br />
Source: Company data, HSBC estimates<br />
Revenue (NTD mn)<br />
OPM<br />
20%<br />
10%<br />
0%<br />
-10%<br />
-20%<br />
-30%<br />
-40%<br />
-50%<br />
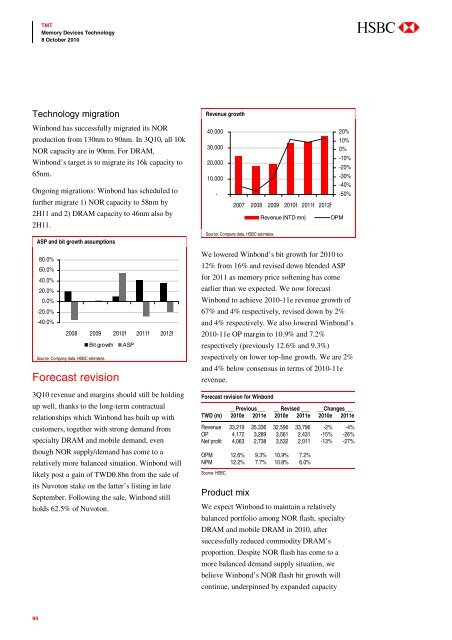
We lowered Winbond’s bit growth for 2010 to<br />
12% from 16% and revised down blended ASP<br />
for 2011 as memory price softening has come<br />
earlier than we expected. We now forecast<br />
Winbond to achieve 2010-11e revenue growth of<br />
67% and 4% respectively, revised down by 2%<br />
and 4% respectively. We also lowered Winbond’s<br />
2010-11e OP margin to 10.9% and 7.2%<br />
respectively (previously 12.6% and 9.3%)<br />
respectively on lower top-line growth. We are 2%<br />
and 4% below consensus in terms of 2010-11e<br />
revenue.<br />
Forecast revision for Winbond<br />
__Previous___ __ Revised ___ __ Changes___<br />
TWD (m) 2010e 2011e 2010e 2011e 2010e 2011e<br />
Revenue 33,219 35,336 32,596 33,796 -2% -4%<br />
OP 4,172 3,289 3,561 2,431 -15% -26%<br />
Net profit 4,063 2,738 3,532 2,011 -13% -27%<br />
OPM 12.6% 9.3% 10.9% 7.2%<br />
NPM 12.2% 7.7% 10.8% 6.0%<br />
Source: HSBC<br />
Product mix<br />
We expect Winbond to maintain a relatively<br />
balanced portfolio among NOR flash, specialty<br />
DRAM and mobile DRAM in 2010, after<br />
successfully reduced commodity DRAM’s<br />
proportion. Despite NOR flash has come to a<br />
more balanced demand supply situation, we<br />
believe Winbond’s NOR flash bit growth will<br />
continue, underpinned by expanded capacity<br />
94