
Create successful ePaper yourself
Turn your PDF publications into a flip-book with our unique Google optimized e-Paper software.
TMT<br />
<strong>Memory</strong> Devices Technology<br />
8 October 2010<br />
abc<br />
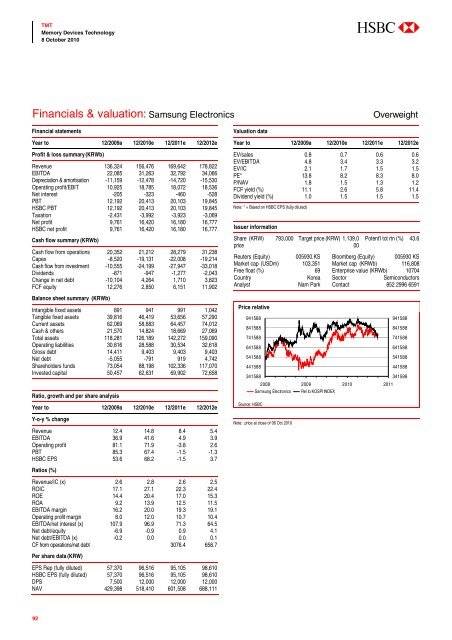
Financials & valuation: Samsung Electronics<br />
Overweight<br />
Financial statements<br />
Year to 12/2009a 12/2010e 12/2011e 12/2012e<br />
Profit & loss summary (KRWb)<br />
Revenue 136,324 156,476 169,642 178,822<br />
EBITDA 22,085 31,263 32,792 34,066<br />
Depreciation & amortisation -11,159 -12,478 -14,720 -15,530<br />
Operating profit/EBIT 10,925 18,785 18,072 18,536<br />
Net interest -205 -323 -460 -528<br />
PBT 12,192 20,413 20,103 19,845<br />
HSBC PBT 12,192 20,413 20,103 19,845<br />
Taxation -2,431 -3,992 -3,923 -3,069<br />
Net profit 9,761 16,420 16,180 16,777<br />
HSBC net profit 9,761 16,420 16,180 16,777<br />
Cash flow summary (KRWb)<br />
Cash flow from operations 20,352 21,212 28,279 31,238<br />
Capex -8,520 -19,131 -22,008 -19,214<br />
Cash flow from investment -10,555 -24,199 -27,947 -33,018<br />
Dividends -871 -947 -1,277 -2,043<br />
Change in net debt -10,104 4,264 1,710 3,823<br />
FCF equity 12,276 2,850 6,151 11,902<br />
Balance sheet summary (KRWb)<br />
Intangible fixed assets 891 941 991 1,042<br />
Tangible fixed assets 39,816 46,419 53,656 57,290<br />
Current assets 62,069 58,683 64,457 74,012<br />
Cash & others 21,570 14,824 18,669 27,069<br />
Total assets 118,281 126,189 142,272 159,090<br />
Operating liabilities 30,816 28,588 30,534 32,618<br />
Gross debt 14,411 9,403 9,403 9,403<br />
Net debt -5,055 -791 919 4,742<br />
Shareholders funds 73,054 88,198 102,336 117,070<br />
Invested capital 50,457 62,631 69,902 72,658<br />
Ratio, growth and per share analysis<br />
Year to 12/2009a 12/2010e 12/2011e 12/2012e<br />
Y-o-y % change<br />
Revenue 12.4 14.8 8.4 5.4<br />
EBITDA 36.9 41.6 4.9 3.9<br />
Operating profit 81.1 71.9 -3.8 2.6<br />
PBT 85.3 67.4 -1.5 -1.3<br />
HSBC EPS 53.6 68.2 -1.5 3.7<br />
Valuation data<br />
Year to 12/2009a 12/2010e 12/2011e 12/2012e<br />
EV/sales 0.8 0.7 0.6 0.6<br />
EV/EBITDA 4.8 3.4 3.3 3.2<br />
EV/IC 2.1 1.7 1.5 1.5<br />
PE* 13.8 8.2 8.3 8.0<br />
P/NAV 1.8 1.5 1.3 1.2<br />
FCF yield (%) 11.1 2.6 5.8 11.4<br />
Dividend yield (%) 1.0 1.5 1.5 1.5<br />
Note: * = Based on HSBC EPS (fully diluted)<br />
Issuer information<br />
Share<br />
price<br />
(KRW) 793,000 Target price (KRW) 1,139,0<br />
00<br />
Potent’l tot rtn (%) 43.6<br />
Reuters (Equity) 005930.KS Bloomberg (Equity) 005930 KS<br />
Market cap (USDm) 103,351 Market cap (KRWb) 116,808<br />
Free float (%) 69 Enterprise value (KRWb) 10704<br />
Country Korea Sector Semiconductors<br />
Analyst Nam Park Contact 852 2996 6591<br />
Price relative<br />
941588<br />
841588<br />
741588<br />
641588<br />
541588<br />
441588<br />
341588<br />
Source: HSBC<br />
2008 2009 2010 2011<br />
Samsung Electronics Rel to KOSPI INDEX<br />
Note: price at close of 06 Oct 2010<br />
941588<br />
841588<br />
741588<br />
641588<br />
541588<br />
441588<br />
341588<br />
Ratios (%)<br />
Revenue/IC (x) 2.6 2.8 2.6 2.5<br />
ROIC 17.1 27.1 22.3 22.4<br />
ROE 14.4 20.4 17.0 15.3<br />
ROA 9.2 13.9 12.5 11.5<br />
EBITDA margin 16.2 20.0 19.3 19.1<br />
Operating profit margin 8.0 12.0 10.7 10.4<br />
EBITDA/net interest (x) 107.9 96.9 71.3 64.5<br />
Net debt/equity -6.9 -0.9 0.9 4.1<br />
Net debt/EBITDA (x) -0.2 0.0 0.0 0.1<br />
CF from operations/net debt 3076.4 658.7<br />
Per share data (KRW)<br />
EPS Rep (fully diluted) 57,370 96,516 95,105 98,610<br />
HSBC EPS (fully diluted) 57,370 96,516 95,105 98,610<br />
DPS 7,500 12,000 12,000 12,000<br />
NAV 429,398 518,410 601,508 688,111<br />
92