
Create successful ePaper yourself
Turn your PDF publications into a flip-book with our unique Google optimized e-Paper software.
TMT<br />
<strong>Memory</strong> Devices Technology<br />
8 October 2010<br />
abc<br />
HSBC vs consensus<br />
(KRWbn) 3Q10e 4Q10e 2010e 2011e<br />
Revenue 41,064 42,884 156,476 169,642<br />
EBITDA 8,083 8,316 31,263 32,792<br />
EBIT 4,942 4,424 18,785 18,072<br />
Net income 4,369 3,781 16,420 16,180<br />
Common EPS (KRW) 29,658 25,669 111,477 109,848<br />
Diluted EPS (KRW) 25,678 22,224 96,516 95,105<br />
EBITDA margin 19.7% 19.4% 20.0% 19.3%<br />
EBIT margin 12.0% 10.3% 12.0% 10.7%<br />
Net margin 10.6% 8.8% 10.5% 9.5%<br />
HSBC vs consensus 3Q10e 4Q10e 2010e 2011e<br />
Revenue 0.0% 1.5% 0.1% 0.6%<br />
EBITDA -7.1% -0.3% 6.3% 12.3%<br />
EBIT -4.6% 6.1% 1.2% 0.1%<br />
Net income -7.1% -2.7% -2.0% 2.2%<br />
EPS (KRW) -11.2% -9.4% -9.1% -4.5%<br />
Consensus 3Q10e 4Q10e 2010e 2011e<br />
Revenue 41,059 42,238 156,312 168,634<br />
EBITDA 8,705 8,341 29,406 29,206<br />
EBIT 5,180 4,169 18,554 18,051<br />
Net income 4,702 3,887 16,750 15,832<br />
EPS (KRW) 28,922 24,523 106,170 99,562<br />
EBITDA margin 21.2% 19.7% 18.8% 17.3%<br />
EBIT margin 12.6% 9.9% 11.9% 10.7%<br />
Net margin 11.5% 9.2% 10.7% 9.4%<br />
Source: I/B/E/S, HSBC forecasts<br />
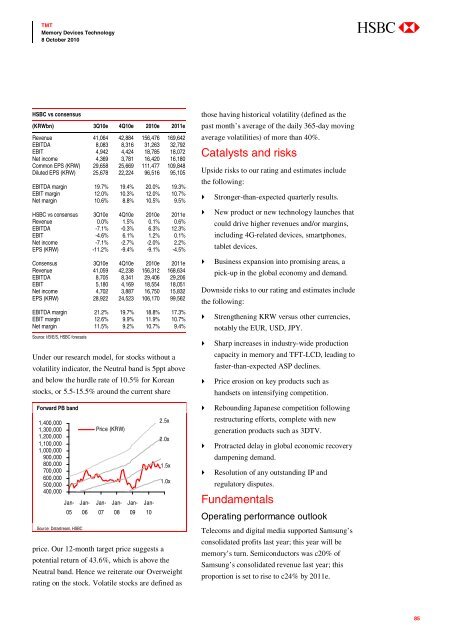
Under our research model, for stocks without a<br />
volatility indicator, the Neutral band is 5ppt above<br />
and below the hurdle rate of 10.5% for Korean<br />
stocks, or 5.5-15.5% around the current share<br />
Forward PB band<br />
1,400,000<br />
1,300,000<br />
1,200,000<br />
1,100,000<br />
1,000,000<br />
900,000<br />
800,000<br />
700,000<br />
600,000<br />
500,000<br />
400,000<br />
Source: Datastream, HSBC<br />
Price (KRW)<br />
Jan-<br />
05<br />
Jan-<br />
06<br />
Jan-<br />
07<br />
Jan-<br />
08<br />
Jan-<br />
09<br />
Jan-<br />
10<br />
2.5x<br />
2.0x<br />
1.5x<br />
1.0x<br />
price. Our 12-month target price suggests a<br />
potential return of 43.6%, which is above the<br />
Neutral band. Hence we reiterate our Overweight<br />
rating on the stock. Volatile stocks are defined as<br />
those having historical volatility (defined as the<br />
past month’s average of the daily 365-day moving<br />
average volatilities) of more than 40%.<br />
Catalysts and risks<br />
Upside risks to our rating and estimates include<br />
the following:<br />
Stronger-than-expected quarterly results.<br />
New product or new technology launches that<br />
could drive higher revenues and/or margins,<br />
including 4G-related devices, smartphones,<br />
tablet devices.<br />
Business expansion into promising areas, a<br />
pick-up in the global economy and demand.<br />
Downside risks to our rating and estimates include<br />
the following:<br />
Strengthening KRW versus other currencies,<br />
notably the EUR, USD, JPY.<br />
Sharp increases in industry-wide production<br />
capacity in memory and TFT-LCD, leading to<br />
faster-than-expected ASP declines.<br />
Price erosion on key products such as<br />
handsets on intensifying competition.<br />
Rebounding Japanese competition following<br />
restructuring efforts, complete with new<br />
generation products such as 3DTV.<br />
Protracted delay in global economic recovery<br />
dampening demand.<br />
Resolution of any outstanding IP and<br />
regulatory disputes.<br />
Fundamentals<br />
Operating performance outlook<br />
Telecoms and digital media supported Samsung’s<br />
consolidated profits last year; this year will be<br />
memory’s turn. Semiconductors was c20% of<br />
Samsung’s consolidated revenue last year; this<br />
proportion is set to rise to c24% by 2011e.<br />
85