
You also want an ePaper? Increase the reach of your titles
YUMPU automatically turns print PDFs into web optimized ePapers that Google loves.
TMT<br />
<strong>Memory</strong> Devices Technology<br />
8 October 2010<br />
abc<br />
HSBC vs consensus<br />
HSBC 2010e 2011e 2012e<br />
Revenue 46,535 66,433 79,103<br />
EBITDA 28,578 41,830 49,352<br />
EBIT (3,755) 5,642 10,072<br />
Netincome (5,496) 3,167 7,136<br />
EPS(TWD) (1.2) 0.7 1.5<br />
EBITDAmargin 61.4% 63.0% 62.4%<br />
EBITmargin -8.1% 8.5% 12.7%<br />
Netmargin -11.8% 4.8% 9.0%<br />
HSBC vs consensus 2010e 2011e 2012e<br />
Revenue -12.6% -3.1% 9.6%<br />
EBITDA -14.9% -7.7% 0.4%<br />
EBIT -329.6% -43.9% -33.7%<br />
Net income -2178.4% -60.5% -18.1%<br />
EPS (TWD) -761.2% -70.4% -37.9%<br />
Consensus 2010e 2011e 2012e<br />
Revenue 53,219 68,564 72,195<br />
EBITDA 33,583 45,319 49,158<br />
EBIT 1,636 10,050 15,188<br />
Net income 264 8,010 8,715<br />
EPS (TWD) 0.2 2.3 2.5<br />
EBITDA margin 63.1% 66.1% 68.1%<br />
EBIT margin 3.1% 14.7% 21.0%<br />
Net margin 0.5% 11.7% 12.1%<br />
Source: Company data, I/B/E/S consensus<br />
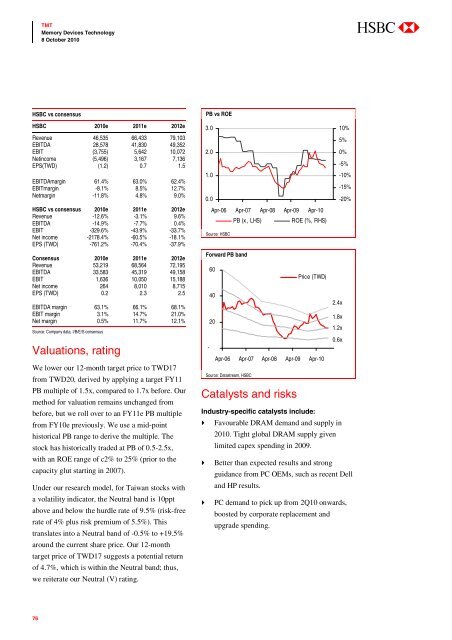
Valuations, rating<br />
We lower our 12-month target price to TWD17<br />
from TWD20, derived by applying a target FY11<br />
PB multiple of 1.5x, compared to 1.7x before. Our<br />
method for valuation remains unchanged from<br />
before, but we roll over to an FY11e PB multiple<br />
from FY10e previously. We use a mid-point<br />
historical PB range to derive the multiple. The<br />
stock has historically traded at PB of 0.5-2.5x,<br />
with an ROE range of c2% to 25% (prior to the<br />
capacity glut starting in 2007).<br />
Under our research model, for Taiwan stocks with<br />
a volatility indicator, the Neutral band is 10ppt<br />
above and below the hurdle rate of 9.5% (risk-free<br />
rate of 4% plus risk premium of 5.5%). This<br />
translates into a Neutral band of -0.5% to +19.5%<br />
around the current share price. Our 12-month<br />
target price of TWD17 suggests a potential return<br />
of 4.7%, which is within the Neutral band; thus,<br />
we reiterate our Neutral (V) rating.<br />
PB vs ROE<br />
3.0<br />
10%<br />
5%<br />
2.0<br />
0%<br />
-5%<br />
1.0<br />
-10%<br />
-15%<br />
0.0<br />
-20%<br />
Apr-06 Apr-07 Apr-08 Apr-09 Apr-10<br />
PB (x , LHS)<br />
ROE (%, RHS)<br />
Source: HSBC<br />
Forward PB band<br />
60<br />
Price (TWD)<br />
40<br />
2.4x<br />
1.8x<br />
20<br />
1.2x<br />
0.6x<br />
-<br />
Apr-06 Apr-07 Apr-08 Apr-09 Apr-10<br />
Source: Datastream, HSBC<br />
Catalysts and risks<br />
Industry-specific catalysts include:<br />
Favourable DRAM demand and supply in<br />
2010. Tight global DRAM supply given<br />
limited capex spending in 2009.<br />
Better than expected results and strong<br />
guidance from PC OEMs, such as recent Dell<br />
and HP results.<br />
PC demand to pick up from 2Q10 onwards,<br />
boosted by corporate replacement and<br />
upgrade spending.<br />
76