
You also want an ePaper? Increase the reach of your titles
YUMPU automatically turns print PDFs into web optimized ePapers that Google loves.
TMT<br />
<strong>Memory</strong> Devices Technology<br />
8 October 2010<br />
abc<br />
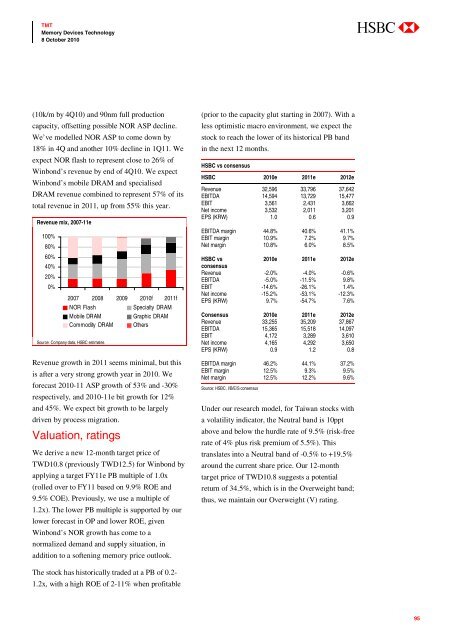
(10k/m by 4Q10) and 90nm full production<br />
capacity, offsetting possible NOR ASP decline.<br />
We’ve modelled NOR ASP to come down by<br />
18% in 4Q and another 10% decline in 1Q11. We<br />
expect NOR flash to represent close to 26% of<br />
Winbond’s revenue by end of 4Q10. We expect<br />
Winbond’s mobile DRAM and specialised<br />
DRAM revenue combined to represent 57% of its<br />
total revenue in 2011, up from 55% this year.<br />
Revenue mix, 2007-11e<br />
100%<br />
80%<br />
60%<br />
40%<br />
20%<br />
0%<br />
2007 2008 2009 2010f 2011f<br />
NOR Flash<br />
Specialty DRAM<br />
Mobile DRAM<br />
Graphic DRAM<br />
Commodity DRAM Others<br />
Source: Company data, HSBC estimates<br />
Revenue growth in 2011 seems minimal, but this<br />
is after a very strong growth year in 2010. We<br />
forecast 2010-11 ASP growth of 53% and -30%<br />
respectively, and 2010-11e bit growth for 12%<br />
and 45%. We expect bit growth to be largely<br />
driven by process migration.<br />
Valuation, ratings<br />
We derive a new 12-month target price of<br />
TWD10.8 (previously TWD12.5) for Winbond by<br />
applying a target FY11e PB multiple of 1.0x<br />
(rolled over to FY11 based on 9.9% ROE and<br />
9.5% COE). Previously, we use a multiple of<br />
1.2x). The lower PB multiple is supported by our<br />
lower forecast in OP and lower ROE, given<br />
Winbond’s NOR growth has come to a<br />
normalized demand and supply situation, in<br />
addition to a softening memory price outlook.<br />
(prior to the capacity glut starting in 2007). With a<br />
less optimistic macro environment, we expect the<br />
stock to reach the lower of its historical PB band<br />
in the next 12 months.<br />
HSBC vs consensus<br />
HSBC 2010e 2011e 2012e<br />
Revenue 32,596 33,796 37,642<br />
EBITDA 14,594 13,729 15,477<br />
EBIT 3,561 2,431 3,662<br />
Net income 3,532 2,011 3,201<br />
EPS (KRW) 1.0 0.6 0.9<br />
EBITDA margin 44.8% 40.6% 41.1%<br />
EBIT margin 10.9% 7.2% 9.7%<br />
Net margin 10.8% 6.0% 8.5%<br />
HSBC vs<br />
2010e 2011e 2012e<br />
consensus<br />
Revenue -2.0% -4.0% -0.6%<br />
EBITDA -5.0% -11.5% 9.8%<br />
EBIT -14.6% -26.1% 1.4%<br />
Net income -15.2% -53.1% -12.3%<br />
EPS (KRW) 9.7% -54.7% 7.6%<br />
Consensus 2010e 2011e 2012e<br />
Revenue 33,255 35,209 37,867<br />
EBITDA 15,365 15,518 14,097<br />
EBIT 4,172 3,289 3,610<br />
Net income 4,165 4,292 3,650<br />
EPS (KRW) 0.9 1.2 0.8<br />
EBITDA margin 46.2% 44.1% 37.2%<br />
EBIT margin 12.5% 9.3% 9.5%<br />
Net margin 12.5% 12.2% 9.6%<br />
Source: HSBC, I/B/E/S consensus<br />
Under our research model, for Taiwan stocks with<br />
a volatility indicator, the Neutral band is 10ppt<br />
above and below the hurdle rate of 9.5% (risk-free<br />
rate of 4% plus risk premium of 5.5%). This<br />
translates into a Neutral band of -0.5% to +19.5%<br />
around the current share price. Our 12-month<br />
target price of TWD10.8 suggests a potential<br />
return of 34.5%, which is in the Overweight band;<br />
thus, we maintain our Overweight (V) rating.<br />
The stock has historically traded at a PB of 0.2-<br />
1.2x, with a high ROE of 2-11% when profitable<br />
95