
Create successful ePaper yourself
Turn your PDF publications into a flip-book with our unique Google optimized e-Paper software.
TMT<br />
<strong>Memory</strong> Devices Technology<br />
8 October 2010<br />
abc<br />
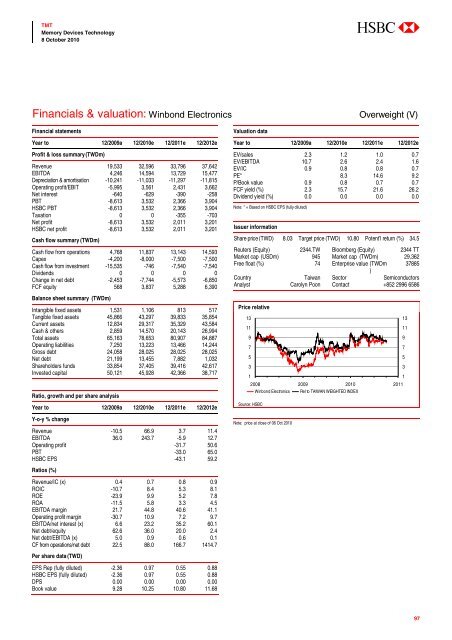
Financials & valuation: Winbond Electronics<br />
Overweight (V)<br />
Financial statements<br />
Year to 12/2009a 12/2010e 12/2011e 12/2012e<br />
Profit & loss summary (TWDm)<br />
Revenue 19,533 32,596 33,796 37,642<br />
EBITDA 4,246 14,594 13,729 15,477<br />
Depreciation & amortisation -10,241 -11,033 -11,297 -11,815<br />
Operating profit/EBIT -5,995 3,561 2,431 3,662<br />
Net interest -640 -629 -390 -258<br />
PBT -8,613 3,532 2,366 3,904<br />
HSBC PBT -8,613 3,532 2,366 3,904<br />
Taxation 0 0 -355 -703<br />
Net profit -8,613 3,532 2,011 3,201<br />
HSBC net profit -8,613 3,532 2,011 3,201<br />
Cash flow summary (TWDm)<br />
Cash flow from operations 4,768 11,837 13,143 14,593<br />
Capex -4,200 -8,000 -7,500 -7,500<br />
Cash flow from investment -15,535 -746 -7,540 -7,540<br />
Dividends 0 0 0 0<br />
Change in net debt -2,453 -7,744 -5,573 -6,850<br />
FCF equity 568 3,837 5,288 6,390<br />
Balance sheet summary (TWDm)<br />
Intangible fixed assets 1,531 1,106 813 517<br />
Tangible fixed assets 45,866 43,297 39,833 35,854<br />
Current assets 12,834 29,317 35,329 43,584<br />
Cash & others 2,859 14,570 20,143 26,994<br />
Total assets 65,163 78,653 80,907 84,887<br />
Operating liabilities 7,250 13,223 13,466 14,244<br />
Gross debt 24,058 28,025 28,025 28,025<br />
Net debt 21,199 13,455 7,882 1,032<br />
Shareholders funds 33,854 37,405 39,416 42,617<br />
Invested capital 50,121 45,928 42,366 38,717<br />
Ratio, growth and per share analysis<br />
Year to 12/2009a 12/2010e 12/2011e 12/2012e<br />
Y-o-y % change<br />
Revenue -10.5 66.9 3.7 11.4<br />
EBITDA 36.0 243.7 -5.9 12.7<br />
Operating profit -31.7 50.6<br />
PBT -33.0 65.0<br />
HSBC EPS -43.1 59.2<br />
Ratios (%)<br />
Revenue/IC (x) 0.4 0.7 0.8 0.9<br />
ROIC -10.7 8.4 5.3 8.1<br />
ROE -23.9 9.9 5.2 7.8<br />
ROA -11.5 5.8 3.3 4.5<br />
EBITDA margin 21.7 44.8 40.6 41.1<br />
Operating profit margin -30.7 10.9 7.2 9.7<br />
EBITDA/net interest (x) 6.6 23.2 35.2 60.1<br />
Net debt/equity 62.6 36.0 20.0 2.4<br />
Net debt/EBITDA (x) 5.0 0.9 0.6 0.1<br />
CF from operations/net debt 22.5 88.0 166.7 1414.7<br />
Per share data (TWD)<br />
EPS Rep (fully diluted) -2.36 0.97 0.55 0.88<br />
HSBC EPS (fully diluted) -2.36 0.97 0.55 0.88<br />
DPS 0.00 0.00 0.00 0.00<br />
Book value 9.28 10.25 10.80 11.68<br />
Valuation data<br />
Year to 12/2009a 12/2010e 12/2011e 12/2012e<br />
EV/sales 2.3 1.2 1.0 0.7<br />
EV/EBITDA 10.7 2.6 2.4 1.6<br />
EV/IC 0.9 0.8 0.8 0.7<br />
PE* 8.3 14.6 9.2<br />
P/Book value 0.9 0.8 0.7 0.7<br />
FCF yield (%) 2.3 15.7 21.6 26.2<br />
Dividend yield (%) 0.0 0.0 0.0 0.0<br />
Note: * = Based on HSBC EPS (fully diluted)<br />
Issuer information<br />
Share price (TWD) 8.03 Target price (TWD) 10.80 Potent’l return (%) 34.5<br />
Reuters (Equity) 2344.TW Bloomberg (Equity) 2344 TT<br />
Market cap (USDm) 945 Market cap (TWDm) 29,362<br />
Free float (%) 74 Enterprise value (TWDm 37885<br />
)<br />
Country Taiwan Sector Semiconductors<br />
Analyst Carolyn Poon Contact +852 2996 6586<br />
Price relative<br />
13<br />
11<br />
9<br />
7<br />
5<br />
3<br />
1<br />
2008 2009 2010 2011<br />
Winbond Electronics Rel to TAIWAN WEIGHTED INDEX<br />
Source: HSBC<br />
Note: price at close of 06 Oct 2010<br />
13<br />
11<br />
9<br />
7<br />
5<br />
3<br />
1<br />
97