
Create successful ePaper yourself
Turn your PDF publications into a flip-book with our unique Google optimized e-Paper software.
TMT<br />
<strong>Memory</strong> Devices Technology<br />
8 October 2010<br />
abc<br />
Financials & valuation: Inotera Memories Inc.<br />
Neutral (V)<br />
Financial statements<br />
Year to 12/2009a 12/2010e 12/2011e 12/2012e<br />
Profit & loss summary (TWDm)<br />
Revenue 36,104 46,535 66,433 79,103<br />
EBITDA 20,154 28,578 41,830 49,352<br />
Depreciation & amortisation -29,795 -32,334 -36,187 -39,279<br />
Operating profit/EBIT -9,641 -3,755 5,642 10,072<br />
Net interest -1,549 -2,047 -2,277 -1,582<br />
PBT -11,477 -5,496 3,725 8,920<br />
HSBC PBT -11,477 -5,496 3,725 8,920<br />
Taxation 0 0 -559 -1,784<br />
Net profit -11,477 -5,496 3,167 7,136<br />
HSBC net profit -11,477 -5,496 3,167 7,136<br />
Cash flow summary (TWDm)<br />
Cash flow from operations 11,228 24,158 34,449 44,520<br />
Capex -13,095 -58,000 -22,300 -12,500<br />
Cash flow from investment -23,341 -35,800 -31,429 -31,629<br />
Dividends 0 0 0 0<br />
Change in net debt -14,367 25,826 -13,822 -29,536<br />
FCF equity -1,867 -33,842 11,591 30,236<br />
Balance sheet summary (TWDm)<br />
Intangible fixed assets 1,447 1,037 779 675<br />
Tangible fixed assets 100,032 125,390 110,889 85,343<br />
Current assets 18,917 18,179 28,157 44,251<br />
Cash & others 5,376 442 3,263 14,799<br />
Total assets 120,396 144,606 139,826 130,269<br />
Operating liabilities 29,459 31,873 34,927 36,234<br />
Gross debt 42,109 63,000 52,000 34,000<br />
Net debt 36,733 62,558 48,737 19,201<br />
Shareholders funds 48,828 49,733 52,899 60,035<br />
Invested capital 85,561 112,291 101,636 79,235<br />
Ratio, growth and per share analysis<br />
Year to 12/2009a 12/2010e 12/2011e 12/2012e<br />
Y-o-y % change<br />
Valuation data<br />
Year to 12/2009a 12/2010e 12/2011e 12/2012e<br />
EV/sales 3.1 3.0 1.9 1.2<br />
EV/EBITDA 5.5 4.8 3.0 1.9<br />
EV/IC 1.3 1.2 1.2 1.2<br />
PE* 23.6 10.5<br />
P/Book value 1.2 1.5 1.4 1.2<br />
FCF yield (%) -2.5 -45.2 15.5 40.4<br />
Dividend yield (%) 0.0 0.0 0.0 0.0<br />
Note: * = Based on HSBC EPS (fully diluted)<br />
Issuer information<br />
Share price (TWD) 16.20 Target price (TWD) 17.0 Potent’l return (%) 4.7<br />
Reuters (Equity) 3474.TW Bloomberg (Equity) 3474 TT<br />
Market cap (USDm) 2,407 Market cap (TWDm) 74,804<br />
Free float (%) 46 Enterprise value (TWDm) 137362<br />
Country Taiwan Sector Electronic Equipment<br />
Analyst Carolyn Poon Contact +852 2996 6586<br />
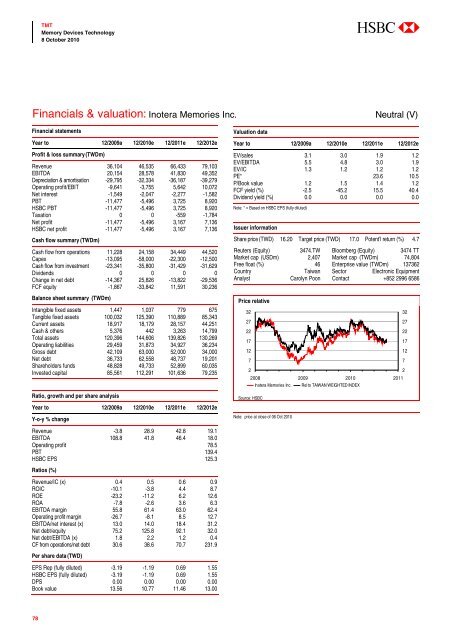
Price relative<br />
32<br />
27<br />
22<br />
17<br />
12<br />
7<br />
2<br />
2008 2009 2010 2011<br />
Inotera Memories Inc. Rel to TAIWAN WEIGHTED INDEX<br />
Source: HSBC<br />
Note: price at close of 06 Oct 2010<br />
32<br />
27<br />
22<br />
17<br />
12<br />
7<br />
2<br />
Revenue -3.8 28.9 42.8 19.1<br />
EBITDA 108.8 41.8 46.4 18.0<br />
Operating profit 78.5<br />
PBT 139.4<br />
HSBC EPS 125.3<br />
Ratios (%)<br />
Revenue/IC (x) 0.4 0.5 0.6 0.9<br />
ROIC -10.1 -3.8 4.4 8.7<br />
ROE -23.2 -11.2 6.2 12.6<br />
ROA -7.8 -2.6 3.6 6.3<br />
EBITDA margin 55.8 61.4 63.0 62.4<br />
Operating profit margin -26.7 -8.1 8.5 12.7<br />
EBITDA/net interest (x) 13.0 14.0 18.4 31.2<br />
Net debt/equity 75.2 125.8 92.1 32.0<br />
Net debt/EBITDA (x) 1.8 2.2 1.2 0.4<br />
CF from operations/net debt 30.6 38.6 70.7 231.9<br />
Per share data (TWD)<br />
EPS Rep (fully diluted) -3.19 -1.19 0.69 1.55<br />
HSBC EPS (fully diluted) -3.19 -1.19 0.69 1.55<br />
DPS 0.00 0.00 0.00 0.00<br />
Book value 13.56 10.77 11.46 13.00<br />
78