Annual Report 2010 - Christchurch City Council
Annual Report 2010 - Christchurch City Council
Annual Report 2010 - Christchurch City Council

Create successful ePaper yourself
Turn your PDF publications into a flip-book with our unique Google optimized e-Paper software.
Streets and transport<br />
<strong>Council</strong> activities and<br />
services<br />
<strong>Annual</strong> <strong>Report</strong><br />
<strong>Christchurch</strong> Otautahi<br />
<strong>2010</strong><br />
p101.<br />
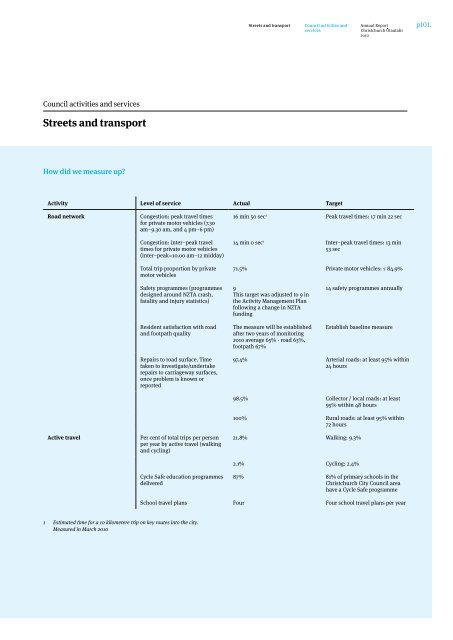
<strong>Council</strong> activities and services<br />
Streets and transport<br />
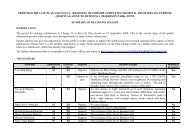
How did we measure up?<br />
Activity Level of service Actual Target<br />
Road network<br />
Congestion: peak travel times<br />
for private motor vehicles (7.30<br />
am–9.30 am, and 4 pm–6 pm)<br />
Congestion: inter–peak travel<br />
times for private motor vehicles<br />
(inter–peak=10.00 am–12 midday)<br />
Total trip proportion by private<br />
motor vehicles<br />
16 min 50 sec 1 Peak travel times: 17 min 22 sec<br />
14 min 0 sec 1 Inter–peak travel times: 13 min<br />
53 sec<br />
71.5% Private motor vehicles: ≤ 84.9%<br />
Safety programmes (programmes<br />
designed around NZTA crash,<br />
fatality and injury statistics)<br />
Resident satisfaction with road<br />
and footpath quality<br />
9<br />
This target was adjusted to 9 in<br />
the Activity Management Plan<br />
following a change in NZTA<br />
funding<br />
The measure will be established<br />
after two years of monitoring<br />
<strong>2010</strong> average 65% - road 63%,<br />
footpath 67%<br />
14 safety programmes annually<br />
Establish baseline measure<br />
Repairs to road surface. Time<br />
taken to investigate/undertake<br />
repairs to carriageway surfaces,<br />
once problem is known or<br />
reported<br />
97.4% Arterial roads: at least 95% within<br />
24 hours<br />
Active travel<br />
Per cent of total trips per person<br />
per year by active travel (walking<br />
and cycling)<br />
Cycle Safe education programmes<br />
delivered<br />
98.5% Collector / local roads: at least<br />
95% within 48 hours<br />
100% Rural roads: at least 95% within<br />
72 hours<br />
21.8% Walking: 9.3%<br />
2.1% Cycling: 2.4%<br />
87% 81% of primary schools in the<br />
<strong>Christchurch</strong> <strong>City</strong> <strong>Council</strong> area<br />
have a Cycle Safe programme<br />
School travel plans Four Four school travel plans per year<br />
1 Estimated time for a 10 kilometere trip on key routes into the city.<br />
Measured in March <strong>2010</strong>