Africa Foreign Investor Survey 2005 - unido
Africa Foreign Investor Survey 2005 - unido
Africa Foreign Investor Survey 2005 - unido

Create successful ePaper yourself
Turn your PDF publications into a flip-book with our unique Google optimized e-Paper software.
for accuracy. The whole sample expects to make new<br />
investments in the next three years totaling over $3 billion<br />
if again we exclude the anticipated MTN-Nigeria<br />
investments. That is an increase of 9 per cent in investments<br />
from the past three years for the sample companies.<br />
The average new investment the companies are<br />
planning to make is $3.34 million (excluding MTN<br />
Nigeria) and table 6.6 gives the means, medians and the<br />
sums for each group.<br />
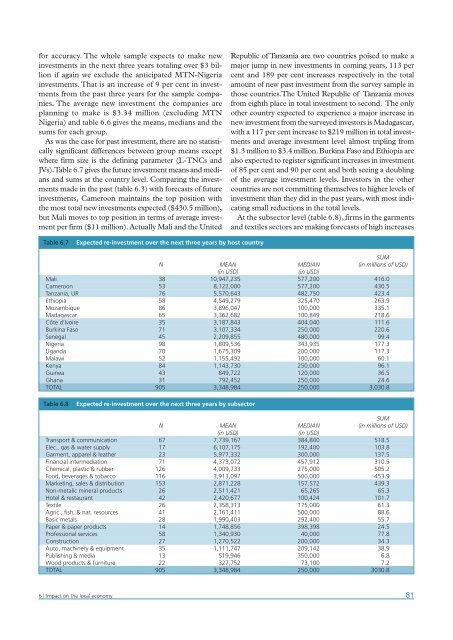
As was the case for past investment, there are no statistically<br />
significant differences between group means except<br />
where firm size is the defining parameter (L-TNCs and<br />
JVs).Table 6.7 gives the future investment means and medians<br />
and sums at the country level. Comparing the investments<br />
made in the past (table 6.3) with forecasts of future<br />
investments, Cameroon maintains the top position with<br />
the most total new investments expected ($430.5 million),<br />
but Mali moves to top position in terms of average investment<br />
per firm ($11 million). Actually Mali and the United<br />
Republic of Tanzania are two countries poised to make a<br />
major jump in new investments in coming years, 113 per<br />
cent and 189 per cent increases respectively in the total<br />
amount of new past investment from the survey sample in<br />
those countries.The United Republic of Tanzania moves<br />
from eighth place in total investment to second. The only<br />
other country expected to experience a major increase in<br />
new investment from the surveyed investors is Madagascar,<br />
with a 117 per cent increase to $219 million in total investments<br />
and average investment level almost tripling from<br />
$1.3 million to $3.4 million. Burkina Faso and Ethiopia are<br />
also expected to register significant increases in investment<br />
of 85 per cent and 90 per cent and both seeing a doubling<br />
of the average investment levels. <strong>Investor</strong>s in the other<br />
countries are not committing themselves to higher levels of<br />
investment than they did in the past years, with most indicating<br />
small reductions in the total levels.<br />
At the subsector level (table 6.8), firms in the garments<br />
and textiles sectors are making forecasts of high increases<br />
Table 6.7<br />
Expected re-investment over the next three years by host country<br />
SUM<br />
N MEAN MEDIAN (in millions of USD)<br />
(in USD)<br />
(in USD)<br />
Mali 38 10,947,235 577,200 416.0<br />
Cameroon 53 8,122,000 577,200 430.5<br />
Tanzania, UR 76 5,570,643 482,750 423.4<br />
Ethiopia 58 4,549,279 325,470 263.9<br />
Mozambique 86 3,896,047 100,000 335.1<br />
Madagascar 65 3,362,682 100,849 218.6<br />
Côte d’Ivoire 35 3,187,843 404,040 111.6<br />
Burkina Faso 71 3,107,334 250,000 220.6<br />
Senegal 45 2,209,855 480,000 99.4<br />
Nigeria 98 1,809,536 343,935 177.3<br />
Uganda 70 1,675,309 200,000 117.3<br />
Malawi 52 1,155,492 100,000 60.1<br />
Kenya 84 1,143,730 250,000 96.1<br />
Guinea 43 849,722 120,000 36.5<br />
Ghana 31 792,452 250,000 24.6<br />
TOTAL 905 3,348,984 250,000 3,030.8<br />
Table 6.8<br />
Expected re-investment over the next three years by subsector<br />
SUM<br />
N MEAN MEDIAN (in millions of USD)<br />
(in USD)<br />
(in USD)<br />
Transport & communication 67 7,739,167 384,800 518.5<br />
Elec., gas & water supply 17 6,107,175 192,400 103.8<br />
Garment, apparel & leather 23 5,977,332 300,000 137.5<br />
Financial intermediation 71 4,373,072 457,912 310.5<br />
Chemical, plastic & rubber 126 4,009,733 275,000 505.2<br />
Food, beverages & tobacco 116 3,913,097 500,000 453.9<br />
Marketing, sales & distribution 153 2,871,228 157,572 439.3<br />
Non-metalic mineral products 26 2,511,421 65,265 65.3<br />
Hotel & restaurant 42 2,420,677 100,424 101.7<br />
Textile 26 2,358,313 175,000 61.3<br />
Agric., fish, & nat. resources 41 2,161,411 500,000 88.6<br />
Basic metals 28 1,990,403 292,400 55.7<br />
Paper & paper products 14 1,748,856 398,398 24.5<br />
Professional services 58 1,340,930 40,000 77.8<br />
Construction 27 1,270,522 200,000 34.3<br />
Auto, machinery & equipment 35 1,111,747 209,142 38.9<br />
Publishing & media 13 519,946 350,000 6.8<br />
Wood products & furniture 22 327,752 73,100 7.2<br />
TOTAL 905 3,348,984 250,000 3030.8<br />
6 | Impact on the local economy<br />
81