Africa Foreign Investor Survey 2005 - unido
Africa Foreign Investor Survey 2005 - unido
Africa Foreign Investor Survey 2005 - unido

Create successful ePaper yourself
Turn your PDF publications into a flip-book with our unique Google optimized e-Paper software.
mean and median of the output per employee for the six<br />
investor type groups. The mean differences between<br />
group components are significant for four of them: organizational<br />
structure; North/South origin; main sectors<br />
and start-up period. Large TNCs’ output per employee<br />
is double that of S-TNCs which is about 75 per cent<br />
higher than that of FEs. North investors average $90,000<br />
sales per employee and South investors average $53,000.<br />
Services sector achieves output per employee double that<br />
of the manufacturers which is five-fold that of agro-business<br />
(primary). Firms established before 1981 on average<br />
achieved sales per employee last year of over<br />
$115,000 compared to between $40,000 and $70,000<br />
for the rest. Groups that exhibited slow sales growth rates<br />
seem to have the highest sales per employee. Evidently,<br />
different parameters were involved in driving high sales<br />
revenue per employee compared to those that determined<br />
whether a particular firm attained high sales<br />
growth. High labour productivity may be associated with<br />
stable, capital intensive, low growth market conditions<br />
where the firms command considerable market share and<br />
do not go after spectacular growth rates to compete.<br />
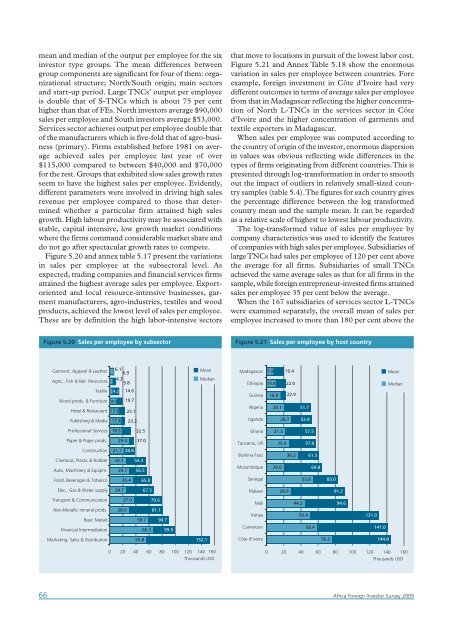
Figure 5.20 and annex table 5.17 present the variations<br />
in sales per employee at the subsectoral level. As<br />
expected, trading companies and financial services firms<br />
attained the highest average sales per employee. Exportoriented<br />
and local resource-intensive businesses, garment<br />
manufacturers, agro-industries, textiles and wood<br />
products, achieved the lowest level of sales per employee.<br />
These are by definition the high labor-intensive sectors<br />
that move to locations in pursuit of the lowest labor cost.<br />
Figure 5.21 and Annex Table 5.18 show the enormous<br />
variation in sales per employee between countries. Fore<br />
example, foreign investment in Côte d’Ivoire had very<br />
different outcomes in terms of average sales per employee<br />
from that in Madagascar reflecting the higher concentration<br />
of North L-TNCs in the services sector in Côte<br />
d’Ivoire and the higher concentration of garments and<br />
textile exporters in Madagascar.<br />
When sales per employee was computed according to<br />
the country of origin of the investor, enormous dispersion<br />
in values was obvious reflecting wide differences in the<br />
types of firms originating from different countries.This is<br />
presented through log-transformation in order to smooth<br />
out the impact of outliers in relatively small-sized country<br />
samples (table 5.4).The figures for each country gives<br />
the percentage difference between the log transformed<br />
country mean and the sample mean. It can be regarded<br />
as a relative scale of highest to lowest labour productivity.<br />
The log-transformed value of sales per employee by<br />
company characteristics was used to identify the features<br />
of companies with high sales per employee. Subsidiaries of<br />
large TNCs had sales per employee of 120 per cent above<br />
the average for all firms. Subsidiaries of small TNCs<br />
achieved the same average sales as that for all firms in the<br />
sample, while foreign entrepreneur-invested firms attained<br />
sales per employee 35 per cent below the average.<br />
When the 167 subsidiaries of services sector L-TNCs<br />
were examined separately, the overall mean of sales per<br />
employee increased to more than 180 per cent above the<br />
Figure 5.20 Sales per employee by subsector<br />
Figure 5.21 Sales per employee by host country<br />
Garment, Apparel & Leather<br />
6.1<br />
6.9<br />
Agric., Fish & Nat. Resources<br />
4.3<br />
9.8<br />
Textile 4.2 14.6<br />
Wood prods. & Furniture 10.5 19.7<br />
Hotel & Restaurant 13.3 23.1<br />
Mean<br />
Median<br />
Madagascar<br />
Ethiopia<br />
Guinea<br />
Nigeria<br />
7.9<br />
10.6<br />
16.0<br />
20.1<br />
19.4<br />
22.0<br />
22.9<br />
51.7<br />
Mean<br />
Median<br />
Publishing & Media<br />
17.4<br />
23.2<br />
Uganda<br />
28.7<br />
52.4<br />
Professional Services<br />
18.5<br />
32.5<br />
Ghana<br />
21.3<br />
57.5<br />
Paper & Paper prods.<br />
29.4<br />
37.0<br />
Tanzania, UR<br />
25.4<br />
57.9<br />
Construction<br />
Chemical, Plastic & Rubber<br />
Auto, Machinery & Equipm.<br />
21.7 38.8<br />
24.1 54.3<br />
29.7 56.5<br />
Burkina Faso<br />
Mozambique<br />
20.0<br />
36.2<br />
61.3<br />
64.8<br />
Food, Beverages & Tobacco<br />
35.4<br />
65.0<br />
Senegal<br />
53.8<br />
83.0<br />
Elec., Gas & Water supply<br />
24.7<br />
67.3<br />
Malawi<br />
28.0<br />
91.2<br />
Transport & Communication<br />
Non-Metallic mineral prods.<br />
Basic Metals<br />
28.9<br />
37.0<br />
58.7<br />
79.6<br />
81.1<br />
90.7<br />
Mali<br />
Kenya<br />
44.2<br />
50.4<br />
94.6<br />
131.0<br />
Financial Intermediation<br />
66.3<br />
99.9<br />
Cameroon<br />
58.4<br />
141.0<br />
Marketing, Sales & Distribution<br />
55.8<br />
152.1<br />
Côte d'Ivoire<br />
76.2<br />
144.8<br />
0 20 40 60 80 100 120 140 160<br />
Thousands USD<br />
0 20 40 60 80 100 120 140 160<br />
Thousands USD<br />
66<br />
<strong>Africa</strong> <strong>Foreign</strong> <strong>Investor</strong> <strong>Survey</strong> <strong>2005</strong>