Africa Foreign Investor Survey 2005 - unido
Africa Foreign Investor Survey 2005 - unido
Africa Foreign Investor Survey 2005 - unido

You also want an ePaper? Increase the reach of your titles
YUMPU automatically turns print PDFs into web optimized ePapers that Google loves.
Entry period (start of operations)<br />
Entry period (start of operations) – regions<br />
of investor origin and subsectors<br />
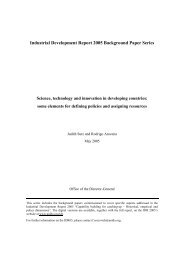
Figures 4.59–4.60 give the age distribution for the<br />
regions of investor origin and of the subsectors.<br />
The investors that had established their operations<br />
before 1980 were typically European in origin and were<br />
concentrated in the utilities sector (electricity, gas and<br />
water supply); construction; basic metal production; publishing<br />
and media; and non-metalic mineral production.<br />
Figure 4.59 Start-up period of investors by region of origin<br />
Asia<br />
Middle East and<br />
Northern <strong>Africa</strong><br />
Sub Saharan <strong>Africa</strong><br />
(ex. South <strong>Africa</strong>)<br />
South <strong>Africa</strong><br />
The Americas and<br />
Oceania<br />
Europe<br />
16<br />
13<br />
15<br />
12<br />
14<br />
8<br />
2<br />
20<br />
19<br />
199<br />
3<br />
74<br />
69<br />
62<br />
53<br />
50<br />
37<br />
204<br />
0% 20% 40% 60% 80% 100%<br />
1980 and before 1981-1990 1991-2000 2001 and after<br />
Note: Numbers in columns represent frequency for each category<br />
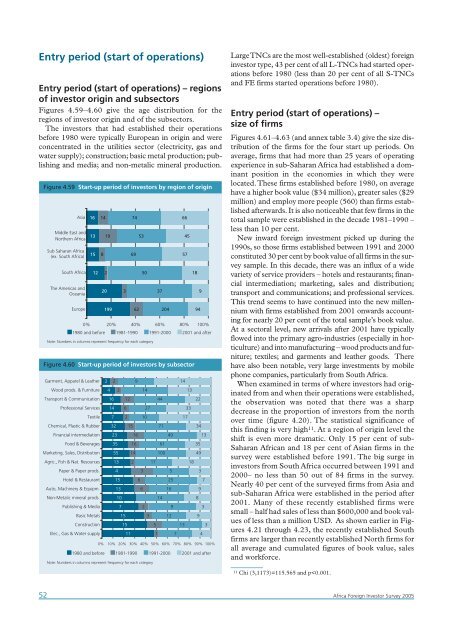
Figure 4.60 Start-up period of investors by subsector<br />
Garment, Apparel & Leather<br />
Wood prods. & Furniture<br />
Transport & Communication<br />
Professional Services<br />
Textile<br />
Chemical, Plastic & Rubber<br />
Financial intermediation<br />
Food & Beverages<br />
Marketing, Sales, Distribution<br />
Agric., Fish & Nat. Resources<br />
Paper & Paper prods.<br />
Hotel & Restaurant<br />
Auto, Machinery & Equipm.<br />
Non-Metalic mineral prods.<br />
Publishing & Media<br />
Basic Metals<br />
Construction<br />
Elec., Gas & Water supply<br />
2<br />
4<br />
16<br />
7<br />
2<br />
14<br />
32<br />
23<br />
35<br />
55<br />
13<br />
4<br />
2<br />
15<br />
13<br />
10<br />
7<br />
15<br />
15<br />
12<br />
6<br />
2<br />
15<br />
11<br />
16<br />
14<br />
2<br />
9<br />
16<br />
6<br />
3<br />
6<br />
14<br />
10<br />
2<br />
27<br />
3<br />
17<br />
5<br />
1<br />
44<br />
71<br />
100<br />
0% 10% 20% 30% 40% 50% 60% 70% 80% 90% 100%<br />
1980 and before 1981-1990 1991-2000 2001 and after<br />
Note: Numbers in columns represent frequency for each category<br />
14<br />
61<br />
49<br />
5<br />
25<br />
16<br />
12<br />
9<br />
7<br />
66<br />
13<br />
45<br />
57<br />
14<br />
17<br />
13<br />
33<br />
18<br />
18<br />
9<br />
94<br />
22<br />
34<br />
35<br />
49<br />
8<br />
9<br />
3<br />
9<br />
13<br />
4<br />
7<br />
3<br />
3<br />
Large TNCs are the most well-established (oldest) foreign<br />
investor type, 43 per cent of all L-TNCs had started operations<br />
before 1980 (less than 20 per cent of all S-TNCs<br />
and FE firms started operations before 1980).<br />
Entry period (start of operations) –<br />
size of firms<br />
Figures 4.61–4.63 (and annex table 3.4) give the size distribution<br />
of the firms for the four start up periods. On<br />
average, firms that had more than 25 years of operating<br />
experience in sub-Saharan <strong>Africa</strong> had established a dominant<br />
position in the economies in which they were<br />
located.These firms established before 1980, on average<br />
have a higher book value ($34 million), greater sales ($29<br />
million) and employ more people (560) than firms established<br />
afterwards. It is also noticeable that few firms in the<br />
total sample were established in the decade 1981–1990 –<br />
less than 10 per cent.<br />
New inward foreign investment picked up during the<br />
1990s, so those firms established between 1991 and 2000<br />
constituted 30 per cent by book value of all firms in the survey<br />
sample. In this decade, there was an influx of a wide<br />
variety of service providers – hotels and restaurants; financial<br />
intermediation; marketing, sales and distribution;<br />
transport and communications; and professional services.<br />
This trend seems to have continued into the new millennium<br />
with firms established from 2001 onwards accounting<br />
for nearly 20 per cent of the total sample’s book value.<br />
At a sectoral level, new arrivals after 2001 have typically<br />
flowed into the primary agro-industries (especially in horticulture)<br />
and into manufacturing – wood products and furniture;<br />
textiles; and garments and leather goods. There<br />
have also been notable, very large investments by mobile<br />
phone companies, particularly from South <strong>Africa</strong>.<br />
When examined in terms of where investors had originated<br />
from and when their operations were established,<br />
the observation was noted that there was a sharp<br />
decrease in the proportion of investors from the north<br />
over time (figure 4.20). The statistical significance of<br />
this finding is very high 11 . At a region of origin level the<br />
shift is even more dramatic. Only 15 per cent of sub-<br />
Saharan <strong>Africa</strong>n and 18 per cent of Asian firms in the<br />
survey were established before 1991. The big surge in<br />
investors from South <strong>Africa</strong> occurred between 1991 and<br />
2000– no less than 50 out of 84 firms in the survey.<br />
Nearly 40 per cent of the surveyed firms from Asia and<br />
sub-Saharan <strong>Africa</strong> were established in the period after<br />
2001. Many of these recently established firms were<br />
small – half had sales of less than $600,000 and book values<br />
of less than a million USD. As shown earlier in Figures<br />
4.21 through 4.23, the recently established South<br />
firms are larger than recently established North firms for<br />
all average and cumulated figures of book value, sales<br />
and workforce.<br />
11 Chi (3,1173)=115.565 and p