Africa Foreign Investor Survey 2005 - unido
Africa Foreign Investor Survey 2005 - unido
Africa Foreign Investor Survey 2005 - unido

Create successful ePaper yourself
Turn your PDF publications into a flip-book with our unique Google optimized e-Paper software.
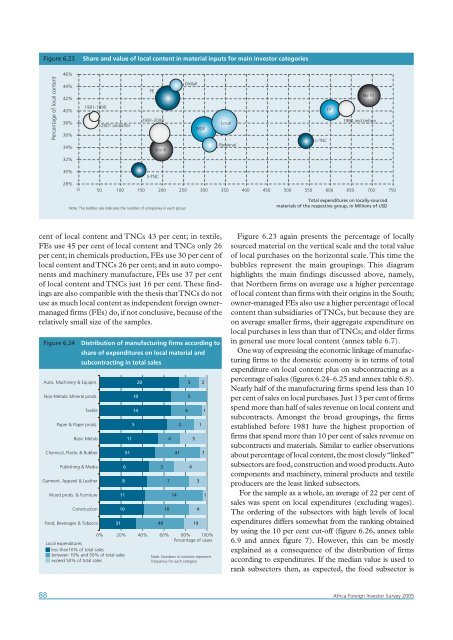
Figure 6.23<br />
Share and value of local content in material inputs for main investor categories<br />
46%<br />
Percentage of local content<br />
44%<br />
42%<br />
40%<br />
38%<br />
36%<br />
34%<br />
1981-1990<br />
2001 and after<br />
FE<br />
1991-2000<br />
South<br />
Global<br />
WOE<br />
Local<br />
Regional<br />
L-TNC<br />
JV<br />
North<br />
1980 and before<br />
32%<br />
30%<br />
28%<br />
0<br />
S-TNC<br />
50 100 150 200 250 300 350 400 450 500 550 600 650 700 750<br />
Note: The bubble size indicates the number of companies in each group<br />
Total expenditures on locally-sourced<br />
materials of the respective group, in Millions of USD<br />
cent of local content and TNCs 43 per cent; in textile,<br />
FEs use 45 per cent of local content and TNCs only 26<br />
per cent; in chemicals production, FEs use 30 per cent of<br />
local content and TNCs 26 per cent; and in auto components<br />
and machinery manufacture, FEs use 37 per cent<br />
of local content and TNCs just 16 per cent.These findings<br />
are also compatible with the thesis that TNCs do not<br />
use as much local content as independent foreign ownermanaged<br />
firms (FEs) do, if not conclusive, because of the<br />
relatively small size of the samples.<br />
Figure 6.24<br />
Auto, Machinery & Equipm.<br />
Non-Metalic Mineral prods.<br />
Food, Beverages & Tobacco<br />
Distribution of manufacturing firms according to<br />
share of expenditures on local material and<br />
subcontracting in total sales<br />
Textile<br />
Paper & Paper prods.<br />
Basic Metals<br />
Chemical, Plastic & Rubber<br />
Publishing & Media<br />
Garment, Apparel & Leather<br />
Wood prods. & Furniture<br />
Construction<br />
31<br />
6<br />
8<br />
11<br />
10<br />
Local expenditures<br />
less than10% of total sales<br />
between 10% and 50% of total sales<br />
exceed 50% of total sales<br />
11<br />
51<br />
10<br />
14<br />
5<br />
20<br />
0% 20% 40% 60% 80% 100%<br />
Percentage of cases<br />
3<br />
40<br />
7<br />
10<br />
4<br />
14<br />
41<br />
2<br />
6<br />
5<br />
5<br />
4<br />
5<br />
3<br />
4<br />
19<br />
Note: Numbers in columns represent<br />
frequency for each category<br />
1<br />
2<br />
1<br />
7<br />
1<br />
Figure 6.23 again presents the percentage of locally<br />
sourced material on the vertical scale and the total value<br />
of local purchases on the horizontal scale.This time the<br />
bubbles represent the main groupings. This diagram<br />
highlights the main findings discussed above, namely,<br />
that Northern firms on average use a higher percentage<br />
of local content than firms with their origins in the South;<br />
owner-managed FEs also use a higher percentage of local<br />
content than subsidiaries of TNCs, but because they are<br />
on average smaller firms, their aggregate expenditure on<br />
local purchases is less than that of TNCs; and older firms<br />
in general use more local content (annex table 6.7).<br />
One way of expressing the economic linkage of manufacturing<br />
firms to the domestic economy is in terms of total<br />
expenditure on local content plus on subcontracting as a<br />
percentage of sales (figures 6.24–6.25 and annex table 6.8).<br />
Nearly half of the manufacturing firms spend less than 10<br />
per cent of sales on local purchases. Just 13 per cent of firms<br />
spend more than half of sales revenue on local content and<br />
subcontracts. Amongst the broad groupings, the firms<br />
established before 1981 have the highest proportion of<br />
firms that spend more than 10 per cent of sales revenue on<br />
subcontracts and materials. Similar to earlier observations<br />
about percentage of local content, the most closely “linked”<br />
subsectors are food, construction and wood products.Auto<br />
components and machinery, mineral products and textile<br />
producers are the least linked subsectors.<br />
For the sample as a whole, an average of 22 per cent of<br />
sales was spent on local expenditures (excluding wages).<br />
The ordering of the subsectors with high levels of local<br />
expenditures differs somewhat from the ranking obtained<br />
by using the 10 per cent cut-off (figure 6.26, annex table<br />
6.9 and annex figure 7). However, this can be mostly<br />
explained as a consequence of the distribution of firms<br />
according to expenditures. If the median value is used to<br />
rank subsectors then, as expected, the food subsector is<br />
88 <strong>Africa</strong> <strong>Foreign</strong> <strong>Investor</strong> <strong>Survey</strong> <strong>2005</strong>