Africa Foreign Investor Survey 2005 - unido
Africa Foreign Investor Survey 2005 - unido
Africa Foreign Investor Survey 2005 - unido

Create successful ePaper yourself
Turn your PDF publications into a flip-book with our unique Google optimized e-Paper software.
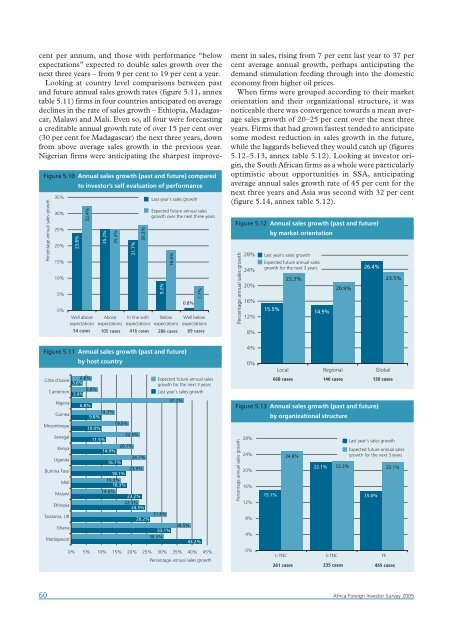
Figure 5.10 Annual sales growth (past and future) compared<br />
to investor’s self evaluation of performance<br />
Percentage annual sales growth<br />
35%<br />
30%<br />
25%<br />
20%<br />
15%<br />
10%<br />
5%<br />
0%<br />
Figure 5.11 Annual sales growth (past and future)<br />
by host country<br />
Côte d'Ivoire<br />
6.8%<br />
3.8%<br />
8.8%<br />
Cameroon<br />
3.9%<br />
Nigeria<br />
Guinea<br />
Mozambique<br />
Senegal<br />
Kenya<br />
Uganda<br />
Burkina Faso<br />
Mali<br />
Malawi<br />
Ethiopia<br />
Tanzania, UR<br />
Ghana<br />
Madagascar<br />
23.8%<br />
32.4%<br />
Well above<br />
expectations<br />
25.2%<br />
25.3%<br />
Above<br />
expectations<br />
21.7%<br />
26.3%<br />
In line with<br />
expectations<br />
6.8%<br />
14.3%<br />
9.8%<br />
19.0%<br />
10.0%<br />
22.5%<br />
11.5%<br />
20.7%<br />
14.9%<br />
24.7%<br />
16.7%<br />
23.9%<br />
18.1%<br />
16.3%<br />
18.3%<br />
14.6%<br />
23.2%<br />
22.3%<br />
24.5%<br />
26.2%<br />
Last year's sales growth<br />
Expected future annual sales<br />
growth over the next three years<br />
Expected future annual sales<br />
growth for the next 3 years<br />
Last year's sales growth<br />
31.8%<br />
33.1%<br />
30.5%<br />
37.2%<br />
39.5%<br />
43.2%<br />
0% 5% 10% 15% 20% 25% 30% 35% 40% 45%<br />
9.2%<br />
18.6%<br />
Below<br />
expectations<br />
0.8%<br />
7.7%<br />
Well below<br />
expectations<br />
54 cases 105 cases 416 cases 286 cases 69 cases<br />
Percentage annual sales growth<br />
cent per annum, and those with performance “below<br />
expectations” expected to double sales growth over the<br />
next three years – from 9 per cent to 19 per cent a year.<br />
Looking at country level comparisons between past<br />
and future annual sales growth rates (figure 5.11, annex<br />
table 5.11) firms in four countries anticipated on average<br />
declines in the rate of sales growth – Ethiopia, Madagascar,<br />
Malawi and Mali. Even so, all four were forecasting<br />
a creditable annual growth rate of over 15 per cent over<br />
(30 per cent for Madagascar) the next three years, down<br />
from above average sales growth in the previous year.<br />
Nigerian firms were anticipating the sharpest improvement<br />
in sales, rising from 7 per cent last year to 37 per<br />
cent average annual growth, perhaps anticipating the<br />
demand stimulation feeding through into the domestic<br />
economy from higher oil prices.<br />
When firms were grouped according to their market<br />
orientation and their organizational structure, it was<br />
noticeable there was convergence towards a mean average<br />
sales growth of 20–25 per cent over the next three<br />
years. Firms that had grown fastest tended to anticipate<br />
some modest reduction in sales growth in the future,<br />
while the laggards believed they would catch up (figures<br />
5.12–5.13, annex table 5.12). Looking at investor origin,<br />
the South <strong>Africa</strong>n firms as a whole were particularly<br />
optimistic about opportunities in SSA, anticipating<br />
average annual sales growth rate of 45 per cent for the<br />
next three years and Asia was second with 32 per cent<br />
(figure 5.14, annex table 5.12).<br />
Figure 5.12 Annual sales growth (past and future)<br />
by market orientation<br />
Percentage annual sales growth<br />
28%<br />
24%<br />
20%<br />
16%<br />
12%<br />
8%<br />
4%<br />
0%<br />
Last year's sales growth<br />
Expected future annual sales<br />
growth for the next 3 years<br />
15.5%<br />
23.3%<br />
14.9%<br />
20.9%<br />
26.4%<br />
Local Regional Global<br />
668 cases 146 cases 130 cases<br />
Figure 5.13 Annual sales growth (past and future)<br />
by organizational structure<br />
Percentage annual sales growth<br />
28%<br />
24%<br />
20%<br />
16%<br />
12%<br />
8%<br />
4%<br />
0%<br />
15.1%<br />
24.8%<br />
22.1%<br />
15.0%<br />
23.5%<br />
Last year's sales growth<br />
Expected future annual sales<br />
growth for the next 3 years<br />
22.3% 22.1%<br />
L-TNC S-TNC FE<br />
261 cases 235 cases 455 cases<br />
60 <strong>Africa</strong> <strong>Foreign</strong> <strong>Investor</strong> <strong>Survey</strong> <strong>2005</strong>