Africa Foreign Investor Survey 2005 - unido
Africa Foreign Investor Survey 2005 - unido
Africa Foreign Investor Survey 2005 - unido

Create successful ePaper yourself
Turn your PDF publications into a flip-book with our unique Google optimized e-Paper software.
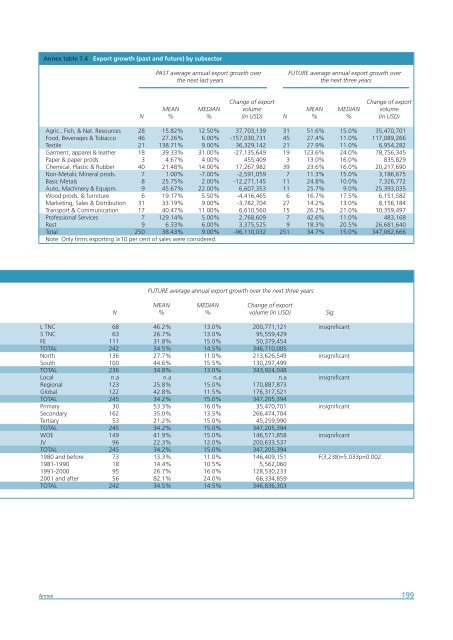
Annex table 7.4 Export growth (past and future) by subsector<br />
PAST average annual export growth over<br />
the next last years<br />
FUTURE average annual export growth over<br />
the next three years<br />
Change of export<br />
Change of export<br />
MEAN MEDIAN volume MEAN MEDIAN volume<br />
N % % (in USD) N % % (in USD)<br />
Agric., Fish, & Nat. Resources 28 15.82% 12.50% 37,703,139 31 51.6% 15.0% 35,470,701<br />
Food, Beverages & Tobacco 46 27.26% 6.00% -157,030,731 45 27.4% 11.0% 117,089,266<br />
Textile 21 138.71% 9.00% 36,329,142 21 27.9% 11.0% 6,954,282<br />
Garment, apparel & leather 18 39.33% 31.00% -27,135,649 19 123.6% 24.0% 78,756,345<br />
Paper & paper prods. 3 4.67% 4.00% 455,409 3 13.0% 16.0% 835,829<br />
Chemical, Plastic & Rubber 40 21.48% 14.00% 17,267,982 39 23.6% 16.0% 20,217,690<br />
Non-Metalic Mineral prods. 7 1.00% -7.00% -2,591,059 7 11.3% 15.0% 3,186,675<br />
Basic Metals 8 25.75% 2.00% -12,271,145 11 24.8% 10.0% 7,326,772<br />
Auto, Machinery & Equipm. 9 45.67% 22.00% 6,607,353 11 25.7% 9.0% 25,393,035<br />
Wood prods. & furniture 6 19.17% 5.50% -4,416,465 6 16.7% 17.5% 6,151,582<br />
Marketing, Sales & Distribution 31 33.19% 9.00% -3,782,704 27 14.2% 13.0% 8,156,184<br />
Transport & Communication 17 40.47% 11.00% 6,610,560 15 26.2% 21.0% 10,359,497<br />
Professional Services 7 129.14% 5.00% 2,768,609 7 42.6% 11.0% 483,168<br />
Rest 9 6.33% 6.00% 3,375,525 9 18.3% 20.5% 26,681,640<br />
Total 250 38.43% 9.00% -96,110,032 251 34.7% 15.0% 347,062,666<br />
Note: Only firms exporting 10 per cent of sales were considered.<br />
FUTURE average annual export growth over the next three years<br />
MEAN MEDIAN Change of export<br />
N % % volume (in USD) Sig.<br />
L TNC 68 46.2% 13.0% 200,771,121 insignificant<br />
S TNC 63 26.7% 13.0% 95,559,429<br />
FE 111 31.8% 15.0% 50,379,454<br />
TOTAL 242 34.5% 14.5% 346,710,005<br />
North 136 27.7% 11.0% 213,626,549 insignificant<br />
South 100 44.6% 15.5% 130,297,499<br />
TOTAL 236 34.8% 13.0% 343,924,048<br />
Local n.a n.a n.a n.a insignificant<br />
Regional 123 25.8% 15.0% 170,887,873<br />
Global 122 42.8% 11.5% 176,317,521<br />
TOTAL 245 34.2% 15.0% 347,205,394<br />
Primary 30 53.3% 16.0% 35,470,701 insignificant<br />
Secondary 162 35.0% 13.5% 266,474,704<br />
Tertiary 53 21.2% 15.0% 45,259,990<br />
TOTAL 245 34.2% 15.0% 347,205,394<br />
WOE 149 41.9% 15.0% 146,571,858 insignificant<br />
JV 96 22.3% 12.0% 200,633,537<br />
TOTAL 245 34.2% 15.0% 347,205,394<br />
1980 and before 73 13.3% 11.0% 146,409,151 F(3,238)=5.033p=0.002<br />
1981-1990 18 14.4% 10.5% 5,562,060<br />
1991-2000 95 26.7% 16.0% 128,530,233<br />
2001 and after 56 82.1% 24.0% 66,334,859<br />
TOTAL 242 34.5% 14.5% 346,836,303<br />
Annex<br />
199