Africa Foreign Investor Survey 2005 - unido
Africa Foreign Investor Survey 2005 - unido
Africa Foreign Investor Survey 2005 - unido

Create successful ePaper yourself
Turn your PDF publications into a flip-book with our unique Google optimized e-Paper software.
sales, old L-TNC, is among the lowest of all groups for<br />
both past and future sales growth. Only 78 S-TNCs<br />
established before 1991 are growing output at an even<br />
lower rate.<br />
The six subgroupings of L-TNCs, S-TNCs and FEs<br />
each split into North and South components is plotted<br />
in figure 5.17 (annex table 5.15).The much higher past<br />
and future growth rates for South L-TNCs over North<br />
L-TNCs; and South S-TNCs over North S-TNCs is<br />
very striking. However, North FEs have grown and<br />
expect to grow faster than South FEs. Another observation<br />
from this graph is that only in the case of L-<br />
TNCs does South differ appreciably from North in<br />
terms of future growth. For all other subgroupings, the<br />
value of expected future growth is between 16 and 25<br />
per cent, but South L-TNCs have a future growth rate<br />
of almost 50 per cent. Similarly, in terms of past growth<br />
rate, South S-TNCs stand out with over 30 per cent<br />
growth.<br />
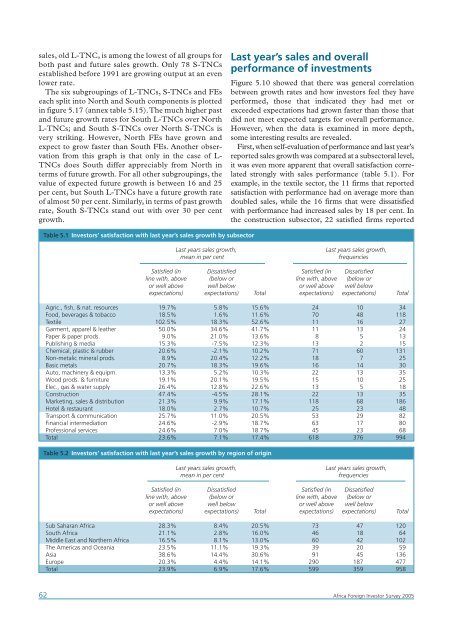
Last year’s sales and overall<br />
performance of investments<br />
Figure 5.10 showed that there was general correlation<br />
between growth rates and how investors feel they have<br />
performed, those that indicated they had met or<br />
exceeded expectations had grown faster than those that<br />
did not meet expected targets for overall performance.<br />
However, when the data is examined in more depth,<br />
some interesting results are revealed.<br />
First, when self-evaluation of performance and last year’s<br />
reported sales growth was compared at a subsectoral level,<br />
it was even more apparent that overall satisfaction correlated<br />
strongly with sales performance (table 5.1). For<br />
example, in the textile sector, the 11 firms that reported<br />
satisfaction with performance had on average more than<br />
doubled sales, while the 16 firms that were dissatisfied<br />
with performance had increased sales by 18 per cent. In<br />
the construction subsector, 22 satisfied firms reported<br />
Table 5.1 <strong>Investor</strong>s’ satisfaction with last year’s sales growth by subsector<br />
Last years sales growth,<br />
mean in per cent<br />
Last years sales growth,<br />
frequencies<br />
Satisfied (in Dissatisfied Satisfied (in Dissatisfied<br />
line with, above (below or line with, above (below or<br />
or well above well below or well above well below<br />
expectations) expectations) Total expectations) expectations) Total<br />
Agric., fish, & nat. resources 19.7% 5.8% 15.6% 24 10 34<br />
Food, beverages & tobacco 18.5% 1.6% 11.6% 70 48 118<br />
Textile 102.5% 18.3% 52.6% 11 16 27<br />
Garment, apparel & leather 50.0% 34.6% 41.7% 11 13 24<br />
Paper & paper prods. 9.0% 21.0% 13.6% 8 5 13<br />
Publishing & media 15.3% -7.5% 12.3% 13 2 15<br />
Chemical, plastic & rubber 20.6% -2.1% 10.2% 71 60 131<br />
Non-metalic mineral prods. 8.9% 20.4% 12.2% 18 7 25<br />
Basic metals 20.7% 18.3% 19.6% 16 14 30<br />
Auto, machinery & equipm. 13.3% 5.2% 10.3% 22 13 35<br />
Wood prods. & furniture 19.1% 20.1% 19.5% 15 10 25<br />
Elec., gas & water supply 26.4% 12.8% 22.6% 13 5 18<br />
Construction 47.4% -4.5% 28.1% 22 13 35<br />
Marketing, sales & distribution 21.3% 9.9% 17.1% 118 68 186<br />
Hotel & restaurant 18.0% 2.7% 10.7% 25 23 48<br />
Transport & communication 25.7% 11.0% 20.5% 53 29 82<br />
Financial intermediation 24.6% -2.9% 18.7% 63 17 80<br />
Professional services 24.6% 7.0% 18.7% 45 23 68<br />
Total 23.6% 7.1% 17.4% 618 376 994<br />
Table 5.2 <strong>Investor</strong>s’ satisfaction with last year’s sales growth by region of origin<br />
Last years sales growth,<br />
mean in per cent<br />
Last years sales growth,<br />
frequencies<br />
Satisfied (in Dissatisfied Satisfied (in Dissatisfied<br />
line with, above (below or line with, above (below or<br />
or well above well below or well above well below<br />
expectations) expectations) Total expectations) expectations) Total<br />
Sub Saharan <strong>Africa</strong> 28.3% 8.4% 20.5% 73 47 120<br />
South <strong>Africa</strong> 21.1% 2.8% 16.0% 46 18 64<br />
Middle East and Northern <strong>Africa</strong> 16.5% 8.1% 13.0% 60 42 102<br />
The Americas and Oceania 23.5% 11.1% 19.3% 39 20 59<br />
Asia 38.6% 14.4% 30.6% 91 45 136<br />
Europe 20.3% 4.4% 14.1% 290 187 477<br />
Total 23.9% 6.9% 17.6% 599 359 958<br />
62<br />
<strong>Africa</strong> <strong>Foreign</strong> <strong>Investor</strong> <strong>Survey</strong> <strong>2005</strong>