Africa Foreign Investor Survey 2005 - unido
Africa Foreign Investor Survey 2005 - unido
Africa Foreign Investor Survey 2005 - unido

Create successful ePaper yourself
Turn your PDF publications into a flip-book with our unique Google optimized e-Paper software.
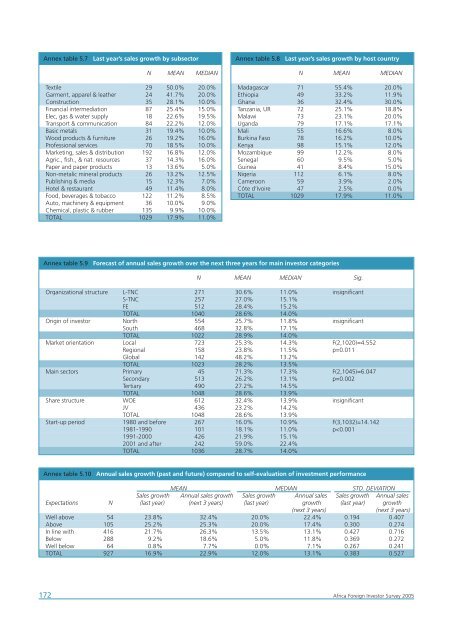
Annex table 5.7<br />
Last year’s sales growth by subsector<br />
Annex table 5.8<br />
Last year’s sales growth by host country<br />
N MEAN MEDIAN<br />
N MEAN MEDIAN<br />
Textile 29 50.0% 20.0%<br />
Garment, apparel & leather 24 41.7% 20.0%<br />
Construction 35 28.1% 10.0%<br />
Financial intermediation 87 25.4% 15.0%<br />
Elec, gas & water supply 18 22.6% 19.5%<br />
Transport & communication 84 22.2% 12.0%<br />
Basic metals 31 19.4% 10.0%<br />
Wood products & furniture 26 19.2% 16.0%<br />
Professional services 70 18.5% 10.0%<br />
Marketing, sales & distribution 192 16.8% 12.0%<br />
Agric., fish., & nat. resources 37 14.3% 16.0%<br />
Paper and paper products 13 13.6% 5.0%<br />
Non-metalic mineral products 26 13.2% 12.5%<br />
Publishing & media 15 12.3% 7.0%<br />
Hotel & restaurant 49 11.4% 8.0%<br />
Food, beverages & tobacco 122 11.2% 8.5%<br />
Auto, machinery & equipment 36 10.0% 9.0%<br />
Chemical, plastic & rubber 135 9.9% 10.0%<br />
TOTAL 1029 17.9% 11.0%<br />
Madagascar 71 55.4% 20.0%<br />
Ethiopia 49 33.2% 11.9%<br />
Ghana 36 32.4% 30.0%<br />
Tanzania, UR 72 25.1% 18.8%<br />
Malawi 73 23.1% 20.0%<br />
Uganda 79 17.1% 17.1%<br />
Mali 55 16.6% 8.0%<br />
Burkina Faso 78 16.2% 10.0%<br />
Kenya 98 15.1% 12.0%<br />
Mozambique 99 12.2% 8.0%<br />
Senegal 60 9.5% 5.0%<br />
Guinea 41 8.4% 15.0%<br />
Nigeria 112 6.1% 8.0%<br />
Cameroon 59 3.9% 2.0%<br />
Côte d’Ivoire 47 2.5% 0.0%<br />
TOTAL 1029 17.9% 11.0%<br />
Annex table 5.9<br />
Forecast of annual sales growth over the next three years for main investor categories<br />
N MEAN MEDIAN Sig.<br />
Organizational structure L-TNC 271 30.6% 11.0% insignificant<br />
S-TNC 257 27.0% 15.1%<br />
FE 512 28.4% 15.2%<br />
TOTAL 1040 28.6% 14.0%<br />
Origin of investor North 554 25.7% 11.8% insignificant<br />
South 468 32.8% 17.1%<br />
TOTAL 1022 28.9% 14.0%<br />
Market orientation Local 723 25.3% 14.3% F(2,1020)=4.552<br />
Regional 158 23.8% 11.5% p=0.011<br />
Global 142 48.2% 13.2%<br />
TOTAL 1023 28.2% 13.5%<br />
Main sectors Primary 45 71.3% 17.3% F(2,1045)=6.047<br />
Secondary 513 26.2% 13.1% p=0.002<br />
Tertiary 490 27.2% 14.5%<br />
TOTAL 1048 28.6% 13.9%<br />
Share structure WOE 612 32.4% 13.9% insignificant<br />
JV 436 23.2% 14.2%<br />
TOTAL 1048 28.6% 13.9%<br />
Start-up period 1980 and before 267 16.0% 10.9% F(3,1032)=14.142<br />
1981-1990 101 18.1% 11.0% p