Africa Foreign Investor Survey 2005 - unido
Africa Foreign Investor Survey 2005 - unido
Africa Foreign Investor Survey 2005 - unido

You also want an ePaper? Increase the reach of your titles
YUMPU automatically turns print PDFs into web optimized ePapers that Google loves.
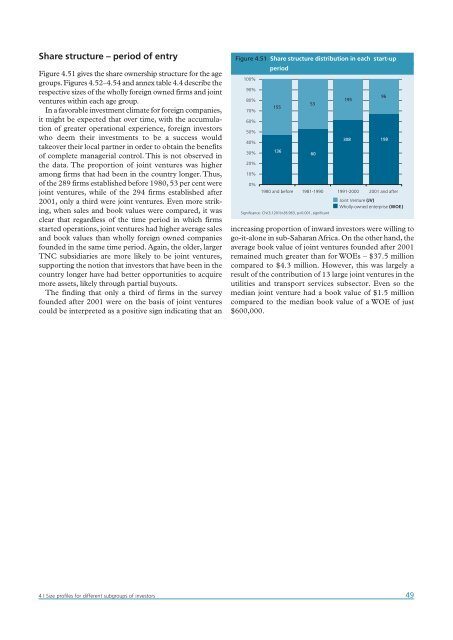
Share structure – period of entry<br />
Figure 4.51 gives the share ownership structure for the age<br />
groups. Figures 4.52–4.54 and annex table 4.4 describe the<br />
respective sizes of the wholly foreign owned firms and joint<br />
ventures within each age group.<br />
In a favorable investment climate for foreign companies,<br />
it might be expected that over time, with the accumulation<br />
of greater operational experience, foreign investors<br />
who deem their investments to be a success would<br />
takeover their local partner in order to obtain the benefits<br />
of complete managerial control. This is not observed in<br />
the data. The proportion of joint ventures was higher<br />
among firms that had been in the country longer. Thus,<br />
of the 289 firms established before 1980, 53 per cent were<br />
joint ventures, while of the 294 firms established after<br />
2001, only a third were joint ventures. Even more striking,<br />
when sales and book values were compared, it was<br />
clear that regardless of the time period in which firms<br />
started operations, joint ventures had higher average sales<br />
and book values than wholly foreign owned companies<br />
founded in the same time period. Again, the older, larger<br />
TNC subsidiaries are more likely to be joint ventures,<br />
supporting the notion that investors that have been in the<br />
country longer have had better opportunities to acquire<br />
more assets, likely through partial buyouts.<br />
The finding that only a third of firms in the survey<br />
founded after 2001 were on the basis of joint ventures<br />
could be interpreted as a positive sign indicating that an<br />
Figure 4.51 Share structure distribution in each start-up<br />
period<br />
100%<br />
90%<br />
80%<br />
70%<br />
60%<br />
50%<br />
40%<br />
30%<br />
20%<br />
10%<br />
0%<br />
155<br />
136<br />
53<br />
60<br />
increasing proportion of inward investors were willing to<br />
go-it-alone in sub-Saharan <strong>Africa</strong>. On the other hand, the<br />
average book value of joint ventures founded after 2001<br />
remained much greater than for WOEs – $37.5 million<br />
compared to $4.3 million. However, this was largely a<br />
result of the contribution of 13 large joint ventures in the<br />
utilities and transport services subsector. Even so the<br />
median joint venture had a book value of $1.5 million<br />
compared to the median book value of a WOE of just<br />
$600,000.<br />
195<br />
308<br />
96<br />
198<br />
1980 and before 1981-1990 1991-2000 2001 and after<br />
Significance: Chi(3,1201)=28.963, p