Africa Foreign Investor Survey 2005 - unido
Africa Foreign Investor Survey 2005 - unido
Africa Foreign Investor Survey 2005 - unido

You also want an ePaper? Increase the reach of your titles
YUMPU automatically turns print PDFs into web optimized ePapers that Google loves.
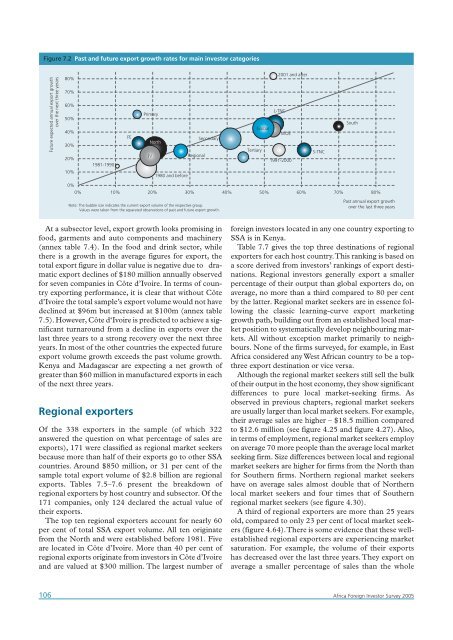
Figure 7.2 Past and future export growth rates for main investor categories<br />
Future expected annual export growth<br />
over the next three yerars<br />
80%<br />
70%<br />
60%<br />
50%<br />
40%<br />
30%<br />
20%<br />
10%<br />
1981-1990<br />
FE<br />
Primary<br />
Secondary<br />
North<br />
JV<br />
Regional<br />
1980 and before<br />
2001 and after<br />
L-TNC<br />
Global<br />
WOE<br />
Tertiary<br />
1991-2000<br />
S-TNC<br />
South<br />
0%<br />
0% 10% 20% 30% 40% 50% 60% 70% 80%<br />
Note: The bubble size indicates the current export volume of the respective group.<br />
Values were taken from the separated observations of past and future export growth.<br />
Past annual export growth<br />
over the last three years<br />
At a subsector level, export growth looks promising in<br />
food, garments and auto components and machinery<br />
(annex table 7.4). In the food and drink sector, while<br />
there is a growth in the average figures for export, the<br />
total export figure in dollar value is negative due to dramatic<br />
export declines of $180 million annually observed<br />
for seven companies in Côte d’Ivoire. In terms of country<br />
exporting performance, it is clear that without Côte<br />
d’Ivoire the total sample’s export volume would not have<br />
declined at $96m but increased at $100m (annex table<br />
7.5). However, Côte d‘Ivoire is predicted to achieve a significant<br />
turnaround from a decline in exports over the<br />
last three years to a strong recovery over the next three<br />
years. In most of the other countries the expected future<br />
export volume growth exceeds the past volume growth.<br />
Kenya and Madagascar are expecting a net growth of<br />
greater than $60 million in manufactured exports in each<br />
of the next three years.<br />
Regional exporters<br />
Of the 338 exporters in the sample (of which 322<br />
answered the question on what percentage of sales are<br />
exports), 171 were classified as regional market seekers<br />
because more than half of their exports go to other SSA<br />
countries. Around $850 million, or 31 per cent of the<br />
sample total export volume of $2.8 billion are regional<br />
exports. Tables 7.5–7.6 present the breakdown of<br />
regional exporters by host country and subsector. Of the<br />
171 companies, only 124 declared the actual value of<br />
their exports.<br />
The top ten regional exporters account for nearly 60<br />
per cent of total SSA export volume. All ten originate<br />
from the North and were established before 1981. Five<br />
are located in Côte d’Ivoire. More than 40 per cent of<br />
regional exports originate from investors in Côte d’Ivoire<br />
and are valued at $300 million. The largest number of<br />
foreign investors located in any one country exporting to<br />
SSA is in Kenya.<br />
Table 7.7 gives the top three destinations of regional<br />
exporters for each host country.This ranking is based on<br />
a score derived from investors’ rankings of export destinations.<br />
Regional investors generally export a smaller<br />
percentage of their output than global exporters do, on<br />
average, no more than a third compared to 80 per cent<br />
by the latter. Regional market seekers are in essence following<br />
the classic learning-curve export marketing<br />
growth path, building out from an established local market<br />
position to systematically develop neighbouring markets.<br />
All without exception market primarily to neighbours.<br />
None of the firms surveyed, for example, in East<br />
<strong>Africa</strong> considered any West <strong>Africa</strong>n country to be a topthree<br />
export destination or vice versa.<br />
Although the regional market seekers still sell the bulk<br />
of their output in the host economy, they show significant<br />
differences to pure local market-seeking firms. As<br />
observed in previous chapters, regional market seekers<br />
are usually larger than local market seekers. For example,<br />
their average sales are higher – $18.5 million compared<br />
to $12.6 million (see figure 4.25 and figure 4.27). Also,<br />
in terms of employment, regional market seekers employ<br />
on average 70 more people than the average local market<br />
seeking firm. Size differences between local and regional<br />
market seekers are higher for firms from the North than<br />
for Southern firms. Northern regional market seekers<br />
have on average sales almost double that of Northern<br />
local market seekers and four times that of Southern<br />
regional market seekers (see figure 4.30).<br />
A third of regional exporters are more than 25 years<br />
old, compared to only 23 per cent of local market seekers<br />
(figure 4.64).There is some evidence that these wellestablished<br />
regional exporters are experiencing market<br />
saturation. For example, the volume of their exports<br />
has decreased over the last three years.They export on<br />
average a smaller percentage of sales than the whole<br />
106 <strong>Africa</strong> <strong>Foreign</strong> <strong>Investor</strong> <strong>Survey</strong> <strong>2005</strong>