Africa Foreign Investor Survey 2005 - unido
Africa Foreign Investor Survey 2005 - unido
Africa Foreign Investor Survey 2005 - unido

You also want an ePaper? Increase the reach of your titles
YUMPU automatically turns print PDFs into web optimized ePapers that Google loves.
5. Analysis of performance<br />
This chapter analyses investors’ self assessment of the<br />
performance in their investments and discusses these<br />
ratings in the light of growth rates of their operations. It<br />
goes on to analyse future sales growth forecasts, capital<br />
intensity and labour productivity.<br />
<strong>Survey</strong> participants were asked to rate the overall performance<br />
of their operations during the past three years<br />
as either well below expectations; below expectations; inline<br />
with expectations; above expectations or well above<br />
expectations. They were also asked to report the percentage<br />
growth of sales over the previous fiscal year and<br />
forecast the annual increase in sales for the next three<br />
years. This chapter provides an analysis of this selfassessment<br />
and the past and predicted future sales<br />
growth rates. In particular, the performance selfappraisal<br />
will be looked at in the framework of sales<br />
growth as reported last year.<br />
In the 2003 survey it was observed that some classes<br />
of investors, for example those in the garments and textile<br />
sectors had very high growth rates and yet assessed<br />
their overall performance as below expectations<br />
(UNIDO, 2003). The question left unanswered was<br />
whether these investors had very high expectations that<br />
left them unsatisfied with even exceptionally high growth<br />
rates or whether they were recent investors just beginning<br />
to expand into recently installed capacity, thus<br />
growing from a very low output base.<br />
The chapter will go further into the analysis of growth<br />
to see which investor groups have the strongest growth<br />
rates and which expect to grow the fastest over the next<br />
three years.This analysis will be concluded with discussions<br />
about the relative efficiencies of the different<br />
investor categories.<br />
Evaluation of past performance<br />
The growing evidence that foreign investment flows into<br />
sub-Saharan <strong>Africa</strong> are improving, as presented in chapters<br />
3 and 4, is further supported through trends in perceptions<br />
of enterprise-level performance. In each of the<br />
UNIDO surveys of 2001, 2003 and <strong>2005</strong>, participants<br />
were asked to evaluate their company’s performance over<br />
the previous three years against their expectations.<br />
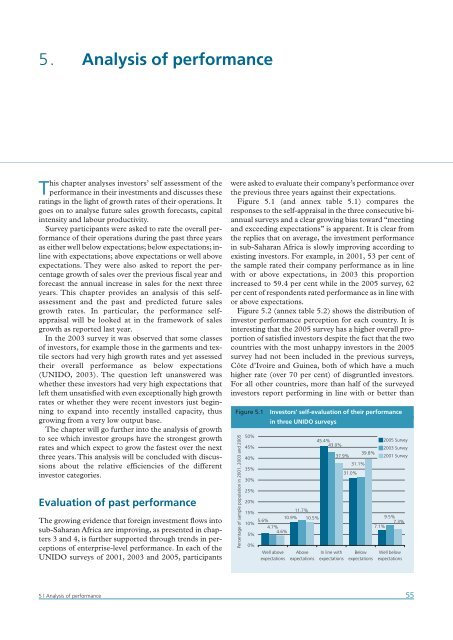
Figure 5.1 (and annex table 5.1) compares the<br />
responses to the self-appraisal in the three consecutive biannual<br />
surveys and a clear growing bias toward “meeting<br />
and exceeding expectations” is apparent. It is clear from<br />
the replies that on average, the investment performance<br />
in sub-Saharan <strong>Africa</strong> is slowly improving according to<br />
existing investors. For example, in 2001, 53 per cent of<br />
the sample rated their company performance as in line<br />
with or above expectations, in 2003 this proportion<br />
increased to 59.4 per cent while in the <strong>2005</strong> survey, 62<br />
per cent of respondents rated performance as in line with<br />
or above expectations.<br />
Figure 5.2 (annex table 5.2) shows the distribution of<br />
investor performance perception for each country. It is<br />
interesting that the <strong>2005</strong> survey has a higher overall proportion<br />
of satisfied investors despite the fact that the two<br />
countries with the most unhappy investors in the <strong>2005</strong><br />
survey had not been included in the previous surveys,<br />
Côte d’Ivoire and Guinea, both of which have a much<br />
higher rate (over 70 per cent) of disgruntled investors.<br />
For all other countries, more than half of the surveyed<br />
investors report performing in line with or better than<br />
Figure 5.1<br />
Percentage of sample population in 2001, 2003 and <strong>2005</strong><br />
50%<br />
45%<br />
40%<br />
35%<br />
30%<br />
25%<br />
20%<br />
<strong>Investor</strong>s' self-evaluation of their performance<br />
in three UNIDO surveys<br />
15%<br />
11.7%<br />
10%<br />
5.6%<br />
10.9% 10.5%<br />
4.7%<br />
5%<br />
4.6%<br />
0%<br />
Well above<br />
expectations<br />
Above<br />
expectations<br />
45.4%<br />
43.0%<br />
37.9%<br />
In line with<br />
expectations<br />
31.0%<br />
31.1%<br />
39.8%<br />
Below<br />
expectations<br />
<strong>2005</strong> <strong>Survey</strong><br />
2003 <strong>Survey</strong><br />
2001 <strong>Survey</strong><br />
9.5%<br />
7.3%<br />
7.1%<br />
Well below<br />
expectations<br />
5 | Analysis of performance<br />
55