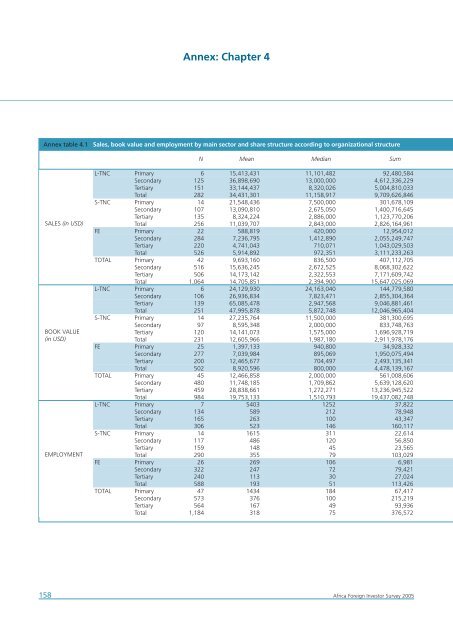
Annex: Chapter 4 Annex table 4.1 Sales, book value and employment by main sector and share structure according to organizational structure N Mean Median Sum SALES L-TNC Primary 6 15,413,431 11,101,482 92,480,584 Secondary 125 36,898,690 13,000,000 4,612,336,229 Tertiary 151 33,144,437 8,320,026 5,004,810,033 Total 282 34,431,301 11,158,917 9,709,626,846 S-TNC Primary 14 21,548,436 7,500,000 301,678,109 Secondary 107 13,090,810 2,675,050 1,400,716,645 SALES (in USD) Tertiary 135 8,324,224 2,886,000 1,123,770,206 Total 256 11,039,707 2,843,000 2,826,164,961 FE Primary 22 588,819 420,000 12,954,012 Secondary 284 7,236,795 1,412,890 2,055,249,747 Tertiary 220 4,741,043 710,071 1,043,029,503 Total 526 5,914,892 972,351 3,111,233,263 TOTAL Primary 42 9,693,160 836,500 407,112,705 Secondary 516 15,636,245 2,672,525 8,068,302,622 Tertiary 506 14,173,142 2,322,553 7,171,609,742 Total 1,064 14,705,851 2,394,900 15,647,025,069 BOOK VALUE L-TNC Primary 6 24,129,930 24,163,040 144,779,580 Secondary 106 26,936,834 7,823,471 2,855,304,364 Tertiary 139 65,085,478 2,947,568 9,046,881,461 Total 251 47,995,878 5,872,748 12,046,965,404 S-TNC Primary 14 27,235,764 11,500,000 381,300,695 BOOK VALUE (in USD) Secondary 97 8,595,348 2,000,000 833,748,763 Tertiary 120 14,141,073 1,575,000 1,696,928,719 Total 231 12,605,966 1,987,180 2,911,978,176 FE Primary 25 1,397,133 940,800 34,928,332 Secondary 277 7,039,984 895,069 1,950,075,494 Tertiary 200 12,465,677 704,497 2,493,135,341 Total 502 8,920,596 800,000 4,478,139,167 TOTAL Primary 45 12,466,858 2,000,000 561,008,606 Secondary 480 11,748,185 1,709,862 5,639,128,620 Tertiary 459 28,838,661 1,272,271 13,236,945,522 Total 984 19,753,133 1,510,793 19,437,082,748 workforce L-TNC Primary 7 5403 1252 37,822 Secondary 134 589 212 78,948 Tertiary 165 263 100 43,347 Total 306 523 146 160,117 S-TNC Primary 14 1615 311 22,614 Secondary 117 486 120 56,850 EMPLOYMENT Tertiary 159 148 45 23,565 Total 290 355 79 103,029 FE Primary 26 269 106 6,981 Secondary 322 247 72 79,421 Tertiary 240 113 30 27,024 Total 588 193 51 113,426 TOTAL Primary 47 1434 184 67,417 Secondary 573 376 100 215,219 Tertiary 564 167 49 93,936 Total 1,184 318 75 376,572 158 <strong>Africa</strong> <strong>Foreign</strong> <strong>Investor</strong> <strong>Survey</strong> <strong>2005</strong>
N Mean Median Sum L-TNC WOE 138 16,224,500 8,273,525 2,238,980,993 JV 144 51,879,485 13,350,636 7,470,645,852 Total 282 34,431,301 11,158,917 9,709,626,846 S-TNC WOE 152 6,514,119 2,500,000 990,146,124 JV 104 17,654,027 3,712,500 1,836,018,836 Total 256 11,039,707 2,843,000 2,826,164,961 FE WOE 327 3,747,534 742,500 1,225,443,536 JV 199 9,476,330 1,600,000 1,885,789,727 Total 526 5,914,892 972,351 3,111,233,263 TOTAL WOE 617 7,219,726 1,700,000 4,454,570,653 JV 447 25,039,048 3,848,000 11,192,454,415 Total 1,064 14,705,851 2,394,900 15,647,025,069 L-TNC WOE 121 11,458,722 2,501,200 1,386,505,390 JV 130 82,003,539 9,338,196 10,660,460,014 Total 251 47,995,878 5,872,748 12,046,965,404 S-TNC WOE 138 6,790,839 1,303,840 937,135,829 JV 93 21,234,864 2,565,000 1,974,842,348 Total 231 12,605,966 1,987,180 2,911,978,176 FE WOE 309 4,804,643 700,000 1,484,634,610 JV 193 15,510,386 1,084,451 2,993,504,558 Total 502 8,920,596 800,000 4,478,139,167 TOTAL WOE 568 6,704,711 1,014,910 3,808,275,829 JV 416 37,569,247 2,494,631 15,628,806,919 Total 984 19,753,133 1,510,793 19,437,082,748 L-TNC WOE 153 468 91 71,579 JV 153 579 211 88,538 Total 306 523 146 160,117 S-TNC WOE 176 299 62 52,589 JV 114 442 110 50,440 Total 290 355 79 103,029 FE WOE 365 148 45 54,164 JV 223 266 75 59,262 Total 588 193 51 113,426 TOTAL WOE 694 257 55 178,332 JV 490 405 112 198,240 Total 1,184 318 75 376,572 Annex 159
- Page 1:
Burkina Faso Cameroon Côte d’Ivo
- Page 4 and 5:
The designations employed and the p
- Page 7:
Preface Investment is the key to un
- Page 11 and 12:
Foreword This is a pioneering and m
- Page 13:
Abbreviations ACP AfrIPANet AGOA AN
- Page 16 and 17:
Africa IPA Network (AfrIPANet) serv
- Page 18 and 19:
historical roots and regional marke
- Page 20 and 21:
cially in the services sector) pay
- Page 22 and 23:
small, labor intensive manufacturin
- Page 24 and 25:
mostly subsidiaries of small TNCs,
- Page 27 and 28:
1. Introduction Little empirical st
- Page 29 and 30:
The simplest linkages involve being
- Page 31 and 32:
One of the objectives of this surve
- Page 33 and 34:
2. Survey methodology Outline of th
- Page 35 and 36:
The initial design of the questionn
- Page 37:
transformation explains the differe
- Page 40 and 41:
adds up to higher than the total FD
- Page 42 and 43:
Figure 3.5 Share of the 15 survey c
- Page 44 and 45:
Figure 3.8 FDI stock - book value o
- Page 46 and 47:
Table 3.2 Top-5 foreign investor su
- Page 48 and 49:
majority of firms global exporters
- Page 50 and 51:
Continuing links with the North Fig
- Page 52 and 53:
Figure 3.24 Sales, book value, and
- Page 54 and 55:
The 25 largest companies in the sur
- Page 56 and 57:
Figure 4.1 Sales according to organ
- Page 58 and 59:
Figure 4.5 Sales by main sector and
- Page 60 and 61:
In terms of job creation, it is cle
- Page 62 and 63:
Figure 4.17 Sales by organizational
- Page 64 and 65:
clear trend of increasing South com
- Page 66 and 67:
of Tanzania. In Western Africa, Cô
- Page 68 and 69:
ook value of South controlled, loca
- Page 70 and 71:
Figure 4.37 Sales by investor origi
- Page 72 and 73:
Figure 4.43 Sales in each start-up
- Page 74 and 75:
Figure 4.50 Share structure distrib
- Page 76 and 77:
Figure 4.52 Sales by share structur
- Page 78 and 79:
Entry period (start of operations)
- Page 80 and 81:
Figure 4.65 Sales by market orienta
- Page 82 and 83:
Figure 5.2 Investors’ self-evalua
- Page 84 and 85:
Figure 5.7 Last year’s sales grow
- Page 86 and 87:
Figure 5.10 Annual sales growth (pa
- Page 88 and 89:
sales, old L-TNC, is among the lowe
- Page 90 and 91:
Figure 5.18 Classification tree of
- Page 92 and 93:
mean and median of the output per e
- Page 94 and 95:
Figure 5.23 Sales per USD book valu
- Page 97 and 98:
6. Impact on the local economy This
- Page 99 and 100:
ices firms pay wages that are more
- Page 101 and 102:
may be affected by the small size i
- Page 103 and 104:
eveals a group of 77 subsidiaries o
- Page 105 and 106:
Table 6.2 gives the distribution by
- Page 107 and 108:
for accuracy. The whole sample expe
- Page 109 and 110:
Figure 6.16 Expected re-investment
- Page 111 and 112:
Local content impacts The analysis
- Page 113 and 114:
other hand, the thesis, according t
- Page 115 and 116:
Figure 6.25 Distribution of main in
- Page 117 and 118:
Technology and know-how transfer In
- Page 119 and 120:
Figure 6.29 Expenditure on training
- Page 121 and 122:
Table 6.17 Number of university gra
- Page 123 and 124:
control is of paramount importance
- Page 125 and 126:
Table 6.18 Foreign investor’s bra
- Page 127:
Summary Wage and employment growth
- Page 130 and 131:
Table 7.1 Exports for main investor
- Page 132 and 133: Figure 7.2 Past and future export g
- Page 134 and 135: Table 7.7 Top regional export desti
- Page 136 and 137: Export markets The long-established
- Page 138 and 139: global exporters’ contribution to
- Page 140 and 141: Table 8.2 Location factors consider
- Page 142 and 143: Figure 8.2 Assessments of changes i
- Page 144 and 145: Figure 8.7 Comparison of importance
- Page 146 and 147: Figure 8.11 Classification tree of
- Page 148 and 149: Figure 8.15 Pre-investment services
- Page 150 and 151: period (average of 15 years) over w
- Page 152 and 153: Figure 9.1 Future employment and in
- Page 154 and 155: taking advantage of the opening up
- Page 156 and 157: associated with FDI. In these count
- Page 158 and 159: Table 9.1 Major characteristics of
- Page 161 and 162: List of tables and figures FIGURES
- Page 163 and 164: Figure 4.65 Sales by market orienta
- Page 165 and 166: Table 3.1 FDI stock - book value of
- Page 167: Annex table 6.10 Expenditures on su
- Page 170 and 171: a work permit? How many engineers/s
- Page 173 and 174: ANNEX
- Page 175 and 176: Annex table 2.1 Detailed definition
- Page 177 and 178: Annex 2.4 Sample size requirements
- Page 179 and 180: Annex table 3.2 Distribution of for
- Page 181 and 182: BOOK VALUE(in USD) WORKFORCE Number
- Page 186 and 187: Annex table 4.2 Sales, book value a
- Page 188 and 189: Annex table 4.3 Sales, book values
- Page 190 and 191: Annex table 4.4 Sales, book value a
- Page 192 and 193: Annex table 4.5 Sales, book value a
- Page 194 and 195: Annex table 4.6 Subsectors by inves
- Page 196 and 197: Annex: Chapter 5 Annex table 5.1 In
- Page 198 and 199: Annex table 5.7 Last year’s sales
- Page 200 and 201: Annex table 5.13 Annual sales growt
- Page 202 and 203: Annex table 5.19 Sales per USD book
- Page 205 and 206: Annex: Chapter 6 Annex table 6.1 Wa
- Page 207 and 208: Annex table 6.3 Annual employment g
- Page 209 and 210: Annex table 6.6 Ratio of expected r
- Page 211 and 212: Percentage of local content MEAN ME
- Page 213 and 214: Annex table 6.11 Expenditure on tra
- Page 215 and 216: Annex table 6.14 Proportion of univ
- Page 217 and 218: Annex table 6.16 Proportion of expa
- Page 219 and 220: Annex figure 6.1 Classification tre
- Page 221 and 222: Annex figure 6.5 Classification tre
- Page 223 and 224: Annex: Chapter 7 Annex table 7.1 To
- Page 225 and 226: Annex table 7.4 Export growth (past
- Page 228 and 229: Annex: Chapter 8 Annex table 8.1 Lo
- Page 230 and 231: Annex table 8.4 Ranking of countrie
- Page 232 and 233: Annex figure 8.1 Assessment of chan
- Page 234 and 235:
Economist Intelligence Unit (EIU) (
- Page 236:
Printed in Austria March 2007 UNITE